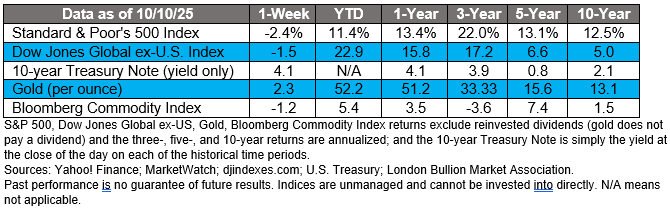
facebook twitter instagram linkedin google youtube vimeo tumblr yelp rss email podcast phone blog search brokercheck brokercheck Play Pause
A Room of One's Own Thumbnail

A Room of One's Own

The Markets

Filling the data void.

Ancient Greek Philosopher Aristotle theorized that nature abhors a void and fills it. Anyone who has ever cleared a garden patch and delayed planting understands the idea. Before long, the empty ground is teeming with opportunistic plants.

The government shutdown created a data void. Usually, the government delivers robust economic data that analysts and investors rely on to better understand where the American economy has been, where it is now, and where it may be going. It’s information the United States Federal Reserve (Fed) relies on to determine whether a rate cut or increase is necessary, reported Megan Leonhardt of Barron’s.

One critical piece of data that has been delayed because of the shutdown is the September 2025 unemployment report. With government data unavailable, Wall Street is turning to alternative sources of information—and those sources are telling different stories. For example, we’ve read that in September U.S. employment:

  • Rebounded. A top financial firm reported “that the economy added about 80,000 jobs in September, showing a rebound from sluggish labor-market growth during the four preceding months,” according to Matt Grossman of Dow Jones via Barron’s.
  • Remained steady. The Chicago Federal Reserve’s Real-Time Unemployment Rate Forecast indicated that the unemployment rate remained unchanged at 4.3 percent for September.
  • Slowed. A global investment company reported, “…data from our portfolio suggest that the collapse in U.S. payroll employment growth continued in September, with monthly gains falling from an average of over 200,000 at the start of the year to just 15,000 over the past three months.”
  • Shrank. A top payroll processor found that “private employers shed 32,000 jobs in September.” It’s a finding that would be at odds with economists’ pre-shutdown forecasts, reported Leonhardt.

The breakeven employment rate, which is the number of new jobs that must be created to keep the employment rate steady, is 32,000 to 82,000, according to the calculations of St. Louis Fed economists Alexander Bick and Victoria Gregory.

Another critical piece of data is the Consumer Price Index (CPI), which measures how prices change from month to month. The October CPI is particularly important because it is used to calculate cost-of-living increases for Social Security recipients. The Social Security Administration is legally required to publish its annual cost-of-living increase for 2026 before November 1, reported Emily Peck of Axios. That’s why the Bureau of Labor Statistics began recalling employees last week The September CPI will be late, but it will be available in October.

Last Friday, major U.S. stock indexes pulled back sharply after trade tensions reignited between the United States and China, reported Connor Smith of Barron’s. Yields on most maturities of U.S. Treasuries moved lower on Friday.


A Room of One's Own

Housing is expensive. Buying a home is out of reach for many Americans because “home prices are historically high relative to incomes”, reported Peyton Whitney of the Joint Center for Housing Studies at Harvard. In 2024, the price of a median single-family home was five times the median household income. (Affordability of homes varies by region.)

Renting isn’t cheap either. The Economist analyzed the affordability of American cities for renters who prefer to live alone. They used “…the rule that a tenant should spend no more than 30 [percent] of their gross income on rent. Using rental prices gathered by…an online property platform, we calculated the salary needed to afford a typical studio apartment in each city.”

Based on median rental prices for August 2025, the publication found the most affordable cities in the United States included: 

  • Wichita, Kansas 
  • Baton Rouge, Louisiana 
  • Lincoln, Nebraska

The report found that some previously unaffordable cities have become affordable, including Knoxville, Tennessee; Denver, Colorado; Madison, Wisconsin; and Norfolk, Virginia.

Then, there are the cities that are affordable only if a renter earns a well-above-average income. The least affordable cities for renters hoping to live alone included:

  • New York City, New York
  • Miami, Florida
  • Jersey City, New Jersey

In addition, “Several of the newly prohibitive cities are in Texas…Last year, both Houston and Dallas were deemed affordable…This year, they fell below that threshold. In Austin, monthly studio rents are now $1,580, a 25 [percent] jump from 2024. This requires a salary of $63,200, more than $10,000 higher than the city’s median wage…Texas has experienced an influx of people in recent years. Many tech firms and other big companies have moved their offices to the state, drawn by low taxes and favorable regulation. Salaries have increased, but rents are rising faster,” reported The Economist.


Weekly Inspiration

“The ache for home lives in all of us. The safe place where we can go as we are and not be questioned.”

 –Maya Angelou, Memoirist and poet

Best Regards,
California Retirement Advisors


Investment advisory services offered through Mutual Advisors, LLC DBA California Retirement Advisors, a SEC registered investment advisor. Securities offered through Mutual Securities, Inc., member FINRA/SIPC. Mutual Securities, Inc. and Mutual Advisors, LLC are affiliated companies. CA Insurance license #0B09076. This content is developed from sources believed to be providing accurate information and provided by California Retirement Advisors. It may not be used for the purpose of avoiding any federal tax penalties. Please consult legal or tax professionals for specific information regarding your individual situation. The opinions expressed and material provided are for general information and should not be considered a solicitation for the purchase or sale of any security. California Retirement Advisors, nor any of its members, are tax accountants or legal attorneys and do not provide tax or legal advice. For tax or legal advice, you should consult your tax or legal professional.
The information being provided is strictly as a courtesy. When you click on any of the links provided here, you are leaving this website and viewing information provided by a third party. We make no representation as to the completeness or accuracy of information provided by any third-party website. Nor is the company liable for any direct or indirect technical or system issues or any consequences arising out of your access to, or your use of third-party technologies, websites, information and programs made available through this website. By accessing these calculators, you assume total responsibility and risk for your use of the third-party website.
* These views are those of Carson Coaching, not the presenting Representative, the Representative’s Broker/Dealer, or Registered Investment Advisor, and should not be construed as investment advice.
* Government bonds and Treasury Bills are guaranteed by the U.S. government as to the timely payment of principal and interest and, if held to maturity, offer a fixed rate of return and fixed principal value.  However, the value of fund shares is not guaranteed and will fluctuate.
* Corporate bonds are considered higher risk than government bonds but normally offer a higher yield and are subject to market, interest rate and credit risk as well as additional risks based on the quality of issuer coupon rate, price, yield, maturity, and redemption features.
* The Standard & Poor's 500 (S&P 500) is an unmanaged group of securities considered to be representative of the stock market in general. You cannot invest directly in this index.
* All indexes referenced are unmanaged. The volatility of indexes could be materially different from that of a client’s portfolio. Unmanaged index returns do not reflect fees, expenses, or sales charges. Index performance is not indicative of the performance of any investment. You cannot invest directly in an index.
* The Dow Jones Global ex-U.S. Index covers approximately 95% of the market capitalization of the 45 developed and emerging countries included in the Index.
* The 10-year Treasury Note represents debt owed by the United States Treasury to the public. Since the U.S. Government is seen as a risk-free borrower, investors use the 10-year Treasury Note as a benchmark for the long-term bond market.
* Gold represents the 3:00 p.m. (London time) gold price as reported by the London Bullion Market Association and is expressed in U.S. Dollars per fine troy ounce. The source for gold data is Federal Reserve Bank of St. Louis (FRED), https://fred.stlouisfed.org/series/GOLDPMGBD228NLBM.
* The Bloomberg Commodity Index is designed to be a highly liquid and diversified benchmark for the commodity futures market. The Index is composed of futures contracts on 19 physical commodities and was launched on July 14, 1998.
* The DJ Equity All REIT Total Return Index measures the total return performance of the equity subcategory of the Real Estate Investment Trust (REIT) industry as calculated by Dow Jones.
* The Dow Jones Industrial Average (DJIA), commonly known as “The Dow,” is an index representing 30 stock of companies maintained and reviewed by the editors of The Wall Street Journal.
* The NASDAQ Composite is an unmanaged index of securities traded on the NASDAQ system.
* International investing involves special risks such as currency fluctuation and political instability and may not be suitable for all investors. These risks are often heightened for investments in emerging markets.
* Yahoo! Finance is the source for any reference to the performance of an index between two specific periods.
* The risk of loss in trading commodities and futures can be substantial. You should therefore carefully consider whether such trading is suitable for you in light of your financial condition. The high degree of leverage is often obtainable in commodity trading and can work against you as well as for you. The use of leverage can lead to large losses as well as gains.
* Opinions expressed are subject to change without notice and are not intended as investment advice or to predict future performance.
* Economic forecasts set forth may not develop as predicted and there can be no guarantee that strategies promoted will be successful.
* Past performance does not guarantee future results. Investing involves risk, including loss of principal.
* The foregoing information has been obtained from sources considered to be reliable, but we do not guarantee it is accurate or complete.
* There is no guarantee a diversified portfolio will enhance overall returns or outperform a non-diversified portfolio. Diversification does not protect against market risk.
* Asset allocation does not ensure a profit or protect against a loss.
* Consult your financial professional before making any investment decision.
Sources: 
https://en.wikipedia.org/wiki/Horror_vacui_(philosophy)
https://www.barrons.com/articles/shutdown-muddles-the-jobs-picture-for-economists-fed-48f547ce  or go to   https://resources.carsongroup.com/hubfs/WMC-Source/2025/10-13-25-Barrons-Shutdown-Muddles-The-Job-2.pdf 
https://www.barrons.com/livecoverage/stock-market-news-today-100625/card/missing-september-economy-stats-seen-as-benign-4WjOev2GisJEdq7U5R3Z?mod=Searchresults   or go to  https://resources.carsongroup.com/hubfs/WMC-Source/2025/10-13-25-Barrons-Missing-September-Economy-3.pdf 
https://www.chicagofed.org/research/data/chicago-fed-labor-market-indicators/latest-release 
https://www.carlyle.com/carlyle-compass/out-left-field-labor-market 
https://adpemploymentreport.com 
https://www.stlouisfed.org/on-the-economy/2025/aug/lower-immigration-projections-mean-lower-breakeven-employment-growth# 
https://www.axios.com/2025/10/10/shutdown-monthly-inflation-report-social-security   or go to  https://resources.carsongroup.com/hubfs/WMC-Source/2025/10-13-25-Axios-Why-The-Shutdown-Isnt-Stopping-8.pdf 
https://www.barrons.com/livecoverage/stock-market-news-today-101025?modCode=hp_LEDE_C_LC   or go to https://resources.carsongroup.com/hubfs/WMC-Source/2025/10-13-25-Barrons-NASDAQ-Sinks-3.6%25-9.pdf 
https://home.treasury.gov/resource-center/data-chart-center/interest-rates/TextView?type=daily_treasury_yield_curve&field_tdr_date_value=2025 
https://www.jchs.harvard.edu/blog/home-prices-surge-five-times-median-income-nearing-historic-highs 
https://www.economist.com/graphic-detail/2025/09/30/where-can-americans-afford-to-live-solo-in-2025   or go to https://resources.carsongroup.com/hubfs/WMC-Source/2025/10-13-25-The-Economist-Where-Can-Americans-Afford-12.pdf 
https://www.goodreads.com/quotes/tag/home