
Ballot Measures and Oil Drove Last Week's Losses. Your Income Plan Shouldn't Depend on Predicting Either.
Last week's two biggest sector losses came from a ballot and a barrel, not from an earnings report. Energy fell 11.88% as oil dropped $13.29, and Information Technology fell 6.93% after Tuesday's election put new limits on the data centers that buy its chips. Five of the 11 sectors in the S&P 500 still rose.
What Happened
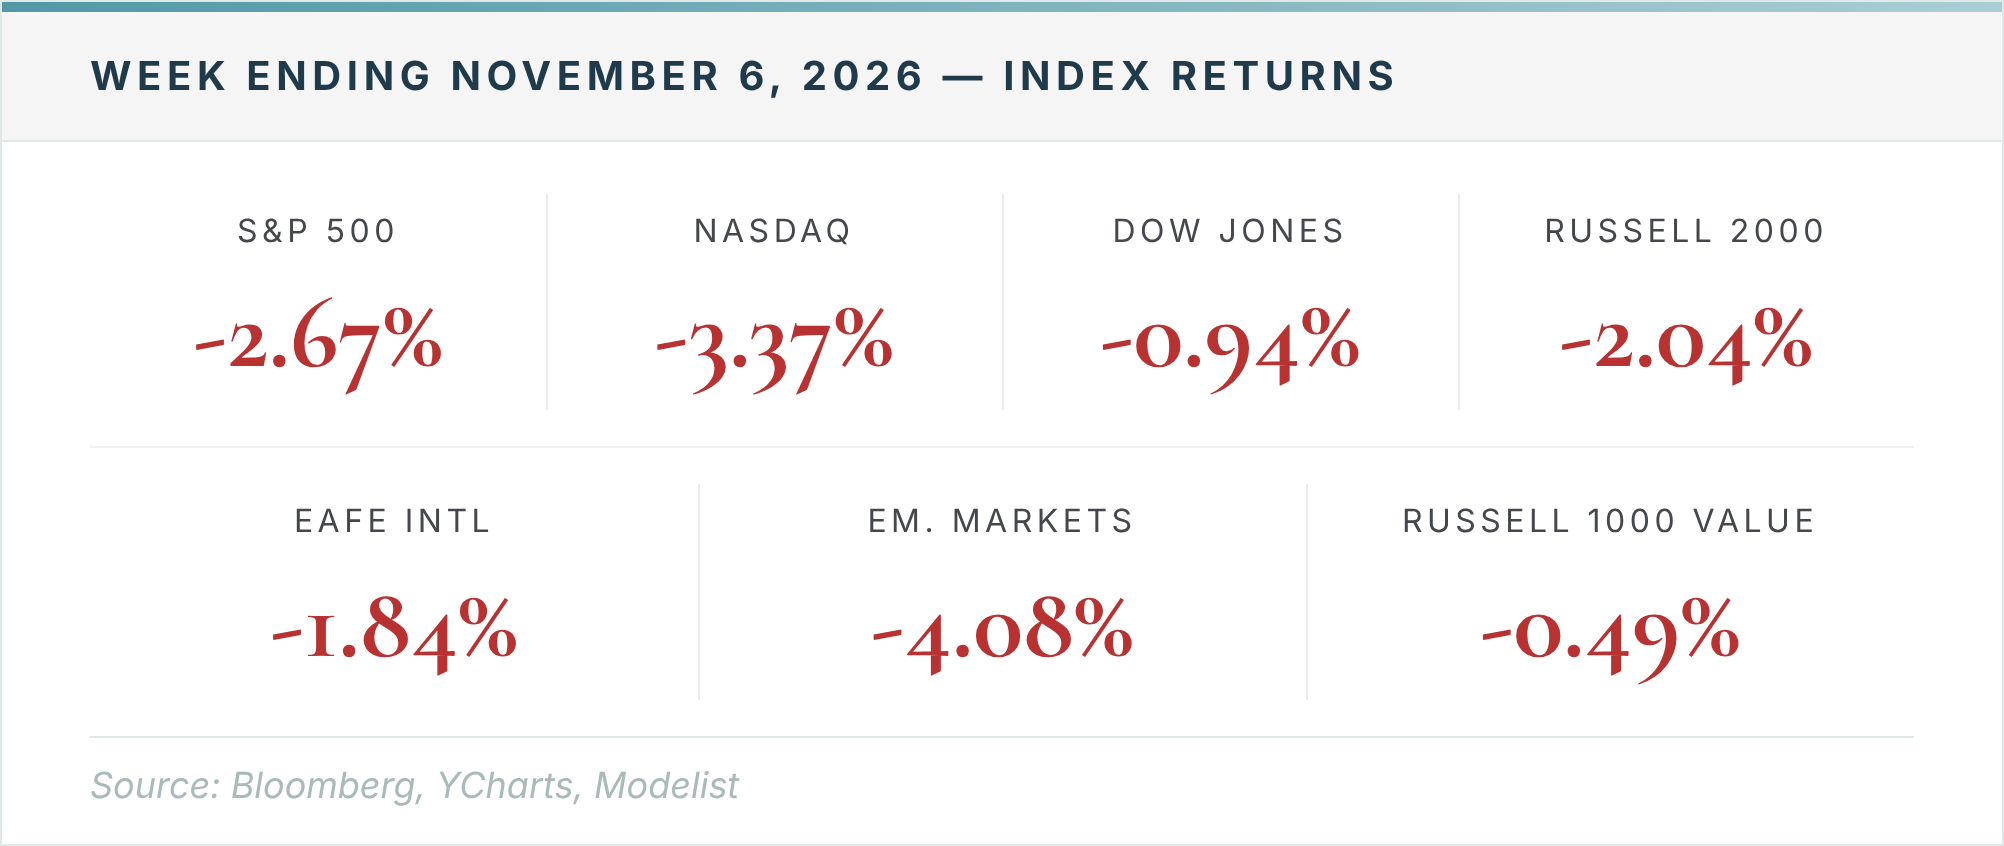
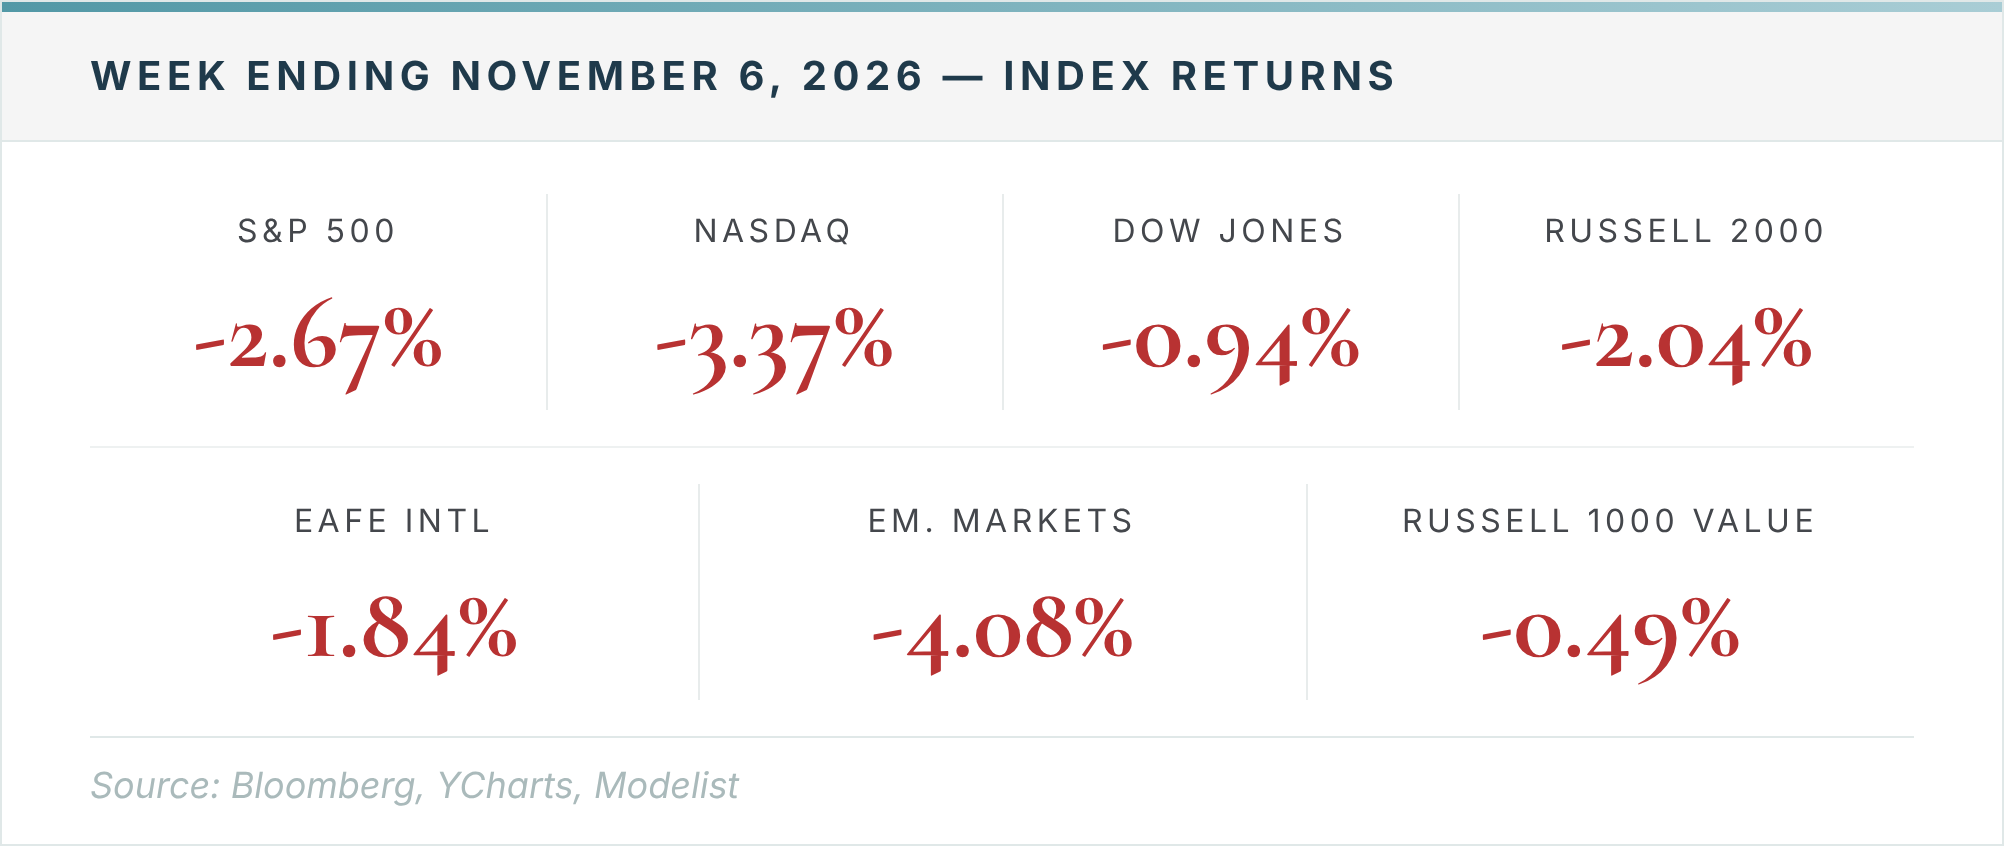
Last week we wrote that most of the market rose while the index most retirement accounts track fell. The same split held again, and this time the cause had a name. The S&P 500 fell 2.67%, while the Russell 1000 Value index, which holds far less technology, slipped 0.49%. Consumer Discretionary, Communication Services, Real Estate, Financials and Consumer Staples all finished the week higher.
Thursday was the turn. The S&P 500 fell 4.4% that day, its worst session since April 2025, and an index of the largest U.S. chipmakers lost 12%. Many of Tuesday's winners had campaigned against new data centers, citing electricity bills and water use, and voters approved limits on data centers in 40 of 41 local ballot measures. Fewer data centers can mean fewer chip orders. That risk came from a ballot, not from anything in a quarterly report. Chip stocks had already fallen 30% from their June high before Thursday, as higher borrowing costs raised questions about how heavy AI spending gets paid for. The election added a second pressure from a different direction.
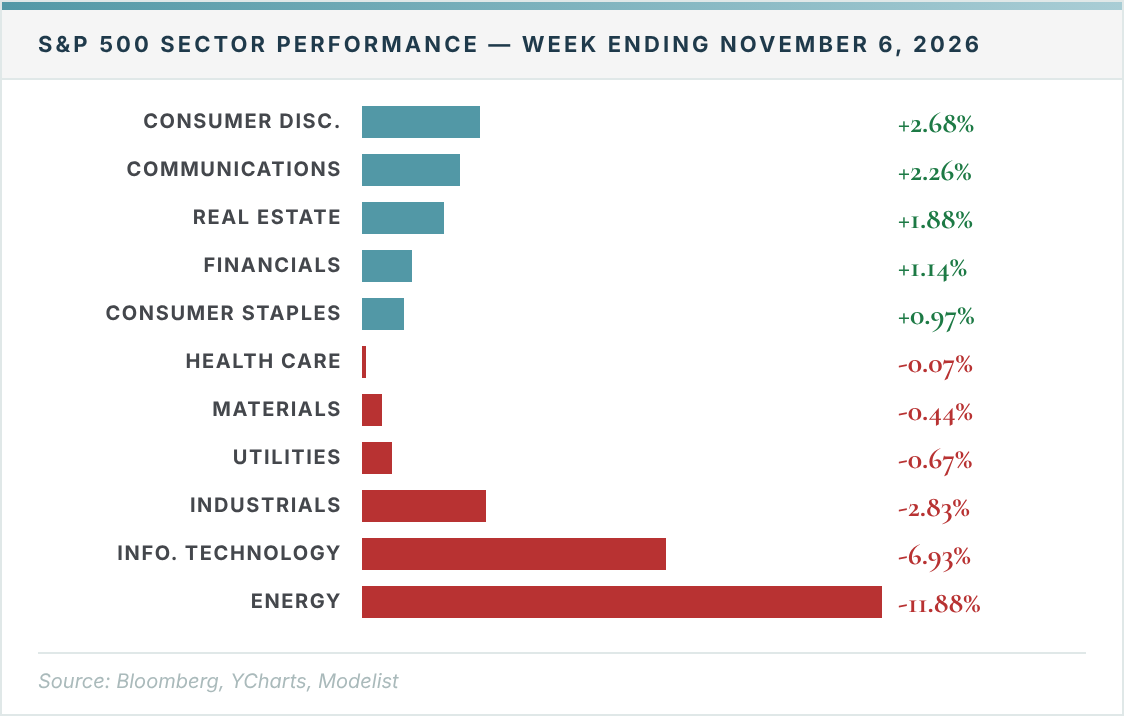
Energy's loss came from the other direction. West Texas Intermediate crude fell $13.29 to $90.83 a barrel. Energy stocks are still up 40.92% for 2026, the most of any sector. The year's biggest gain and the week's biggest loss sit in the same group, moved by a price no single company sets.
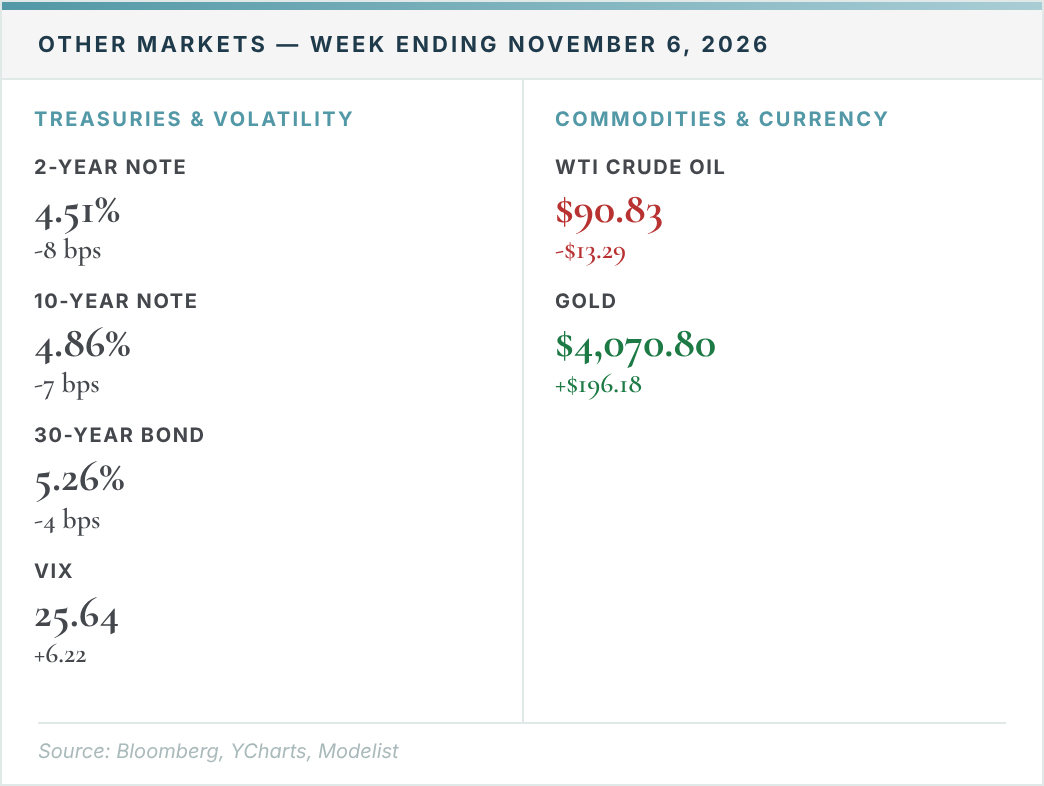
The economy sent a different signal. October payrolls rose 165,000 against expectations of 70,000, and unemployment fell to 4.1%. A report that strong usually pushes Treasury yields up. Instead, the 2-year yield fell 8 basis points to 4.51% and the 10-year fell 7 basis points to 4.86% as money moved toward bonds, while the VIX rose 6.22 points to 25.64. The Federal Reserve held its target range at 3.75% to 4.00% and left a December increase open.
What It Means for Your Retirement Plan
Neither of last week's largest losses could have been read from a balance sheet. One came from local ballot measures and the other from the price of oil. Since the S&P 500's record close on October 6, chip stocks have lost about a third of their value, while health care and consumer staples stocks have each gained more than 10%. A small group of AI-related companies now makes up a large share of the S&P 500, so the index's headline return says more about that group than about a diversified portfolio. A portfolio that depends on a few sectors to keep leading carries risks like these whether or not anyone sees them coming, and a sector that has led for years can grow into a larger share of a portfolio than anyone chose.
That is the mechanism behind The Bucket Plan®: assets are segmented by when they will be needed, and risk is set for each segment rather than by what has been working lately. Money for the next few years of withdrawals sits in its own segment, in holdings a week like this one barely reaches. Stock exposure, including the sectors that have led for two years, sits in the segments meant for later years, where a policy fight or an oil swing has time to play out. If you aren't sure how much of your portfolio rides on a handful of AI-related companies, or which account would fund next year's income after a week like last week, that question is easier to answer now than after the next one.
Questions about how your plan held up last week?
If you are not getting your questions on this topic answered by your current financial advisor and would like to discuss working with us, you may request a meeting here.
Schedule your 20-Minute Due-Diligence Q&A Conversation
What we're watching
Tuesday, November 10: the October Consumer Price Index. The Bureau of Labor Statistics will not publish a year-over-year figure for October this time.
Friday, November 13: the October Producer Price Index.
Disclosures
Investment advisory services offered through Mutual Advisors, LLC DBA California Retirement Advisors, a SEC registered investment adviser. Securities offered through Mutual Securities, Inc., member FINRA/SIPC. Mutual Securities, Inc. and Mutual Advisors, LLC are affiliated companies. CA Insurance license #0B09076.
This content is developed from sources believed to be providing accurate information and provided by California Retirement Advisors. It may not be used for the purpose of avoiding any federal tax penalties. Please consult legal or tax professionals for specific information regarding your individual situation. The opinions expressed and material provided are for general information and should not be considered a solicitation for the purchase or sale of any security. California Retirement Advisors, nor any of its members, are tax accountants or legal attorneys and do not provide tax or legal advice. For tax or legal advice, you should consult your tax or legal professional.
These views are those of California Retirement Advisors and should not be construed as investment advice. All information is believed to be from reliable sources; however, we make no representation as to its completeness or accuracy. The Standard & Poor's 500 (S&P 500) is an unmanaged group of securities considered to be representative of the stock market in general. You cannot invest directly in this index. The Russell 2000 Index measures the performance of the small-cap segment of the U.S. equity universe. The MSCI EAFE Index covers equity markets in Europe, Australasia, and the Far East. All indexes referenced are unmanaged. Unmanaged index returns do not reflect fees, expenses, or sales charges. Index performance is not indicative of the performance of any investment. You cannot invest directly in an index. Past performance does not guarantee future results. Investing involves risk, including loss of principal. Consult your financial professional before making any investment decision.
Sources: Bloomberg, YCharts, Modelist.