

Burgernomics: A Look at the Big Mac Index
Burgernomics and the Big Mac Index Explained
Global markets often rely on complex models to explain currency strength, inflation pressure, and purchasing power. One of the most approachable tools for understanding currency valuation remains the Big Mac Index. Economists refer to this concept as Burgernomics, a simplified way to compare currencies using the price of a single consumer product sold worldwide.
The Big Mac Index uses a standardized item that appears in dozens of countries with minimal variation. That consistency allows analysts to compare what consumers pay in local currencies and measure whether exchange rates reflect real purchasing power.
Market Performance and Currency Pressure in 2025
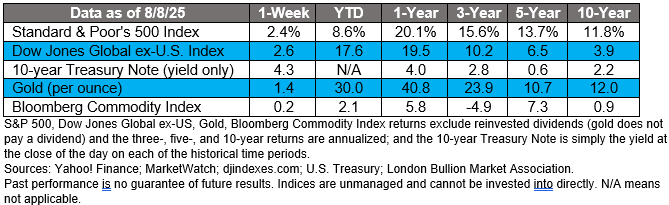
U.S. equity markets showed resilience during the second quarter of 2025. A majority of companies in the S&P 500 reported earnings above analyst expectations, which supported market momentum and investor confidence. Stock indexes approached record levels as earnings growth continued to outpace forecasts.
Economic indicators created tension beneath that optimism. Labor market data softened, consumer spending slowed, and service sector growth hovered near contraction levels. Manufacturing activity continued to decline, which added pressure to broader economic expectations.
At the same time, the U.S. dollar weakened significantly. During the first half of 2025, the dollar recorded its worst performance since the early 1990s. Currency traders adjusted positions as interest rate expectations shifted and global capital flows changed.
This combination of strong corporate earnings and weakening economic data created an environment where currency valuation drew increased attention.
What the Big Mac Index Measures
The Big Mac Index evaluates purchasing-power parity. This economic concept states that identical goods should cost the same across countries once exchange rates align correctly. When prices differ, currencies may appear overvalued or undervalued.
The Economist introduced the index in 1986 as a practical demonstration of purchasing-power parity. Analysts compare the price of a Big Mac in local currency to its price in U.S. dollars. The implied exchange rate then reveals whether a currency trades above or below its theoretical value.
Because McDonald’s maintains standardized ingredients, supply chains, and branding worldwide, the Big Mac serves as a reliable benchmark for cross-border price comparisons.
Big Mac Index Results in July 2025
In July 2025, the average price of a Big Mac in the United States reached $6.01, up from $5.79 earlier in the year. Despite the weaker dollar, many foreign currencies remained undervalued when compared to U.S. pricing.
The index highlighted a sharp divide between Asian and European currency valuations.
Countries With Lower Big Mac Prices Than the U.S.
- Hong Kong priced burgers nearly 50 percent lower than U.S. prices
- Japan and Indonesia both exceeded 40 percent lower pricing
- India remained close to 38 percent below U.S. levels
Countries With Higher Big Mac Prices Than the U.S.
- Switzerland exceeded U.S. prices by more than 50 percent
- Sweden and the euro area showed premiums above 35 percent
- Britain priced burgers more than 30 percent higher
European currencies strengthened relative to the dollar, while several Asian currencies remained deeply undervalued. This gap persisted even after the dollar’s decline earlier in the year.
Why Burgernomics Still Matters
Burgernomics simplifies a complex topic without losing relevance. Investors, policymakers, and economists use the Big Mac Index as a reference point rather than a precise valuation tool. It highlights long-term distortions rather than short-term market swings.
Currency valuation affects trade balances, import costs, inflation trends, and investment flows. When currencies remain undervalued for extended periods, export competitiveness increases while consumer purchasing power declines.
For investors, the index offers insight into regions where currencies may face upward or downward pressure over time. It also helps contextualize headlines about exchange rates by tying them to everyday consumer prices.
Dollar Weakness and Global Pricing Power
A weaker U.S. dollar often raises expectations for cheaper prices abroad. The 2025 data showed that currency adjustments do not always translate directly into consumer pricing changes. Local wages, taxes, real estate costs, and supply chains influence final prices.
In Asia, lower labor costs and domestic demand conditions kept prices suppressed despite currency movements. In Europe, higher operating costs and stronger currencies pushed prices higher relative to the United States.
The Big Mac Index reflects these structural differences while reinforcing the idea that currency value extends beyond exchange rate charts.
Weekly Inspiration
“Every individual… neither intends to promote the public interest, nor knows how much he is promoting it… he intends only his own security; and by directing that industry in such a manner as its produce may be of the greatest value, he intends only his own gain, and he is in this, as in many other cases, led by an invisible hand to promote an end which was no part of his intention.”
― Adam Smith, Philosopher and economist
Plan With Confidence
Secure your financial future with expert guidance. Schedule a complimentary consultation with a licensed advisor today.
Best Regards,
California Retirement Advisors