
Cash Got a Raise Last Week. The Stocks Owned for Their Dividends Fell Hardest.
The Federal Reserve raised rates on Wednesday, and the part of the bond market that follows the Fed moved with it. The part that usually sets the price of dividend-paying stocks did not. Those stocks fell hardest anyway.
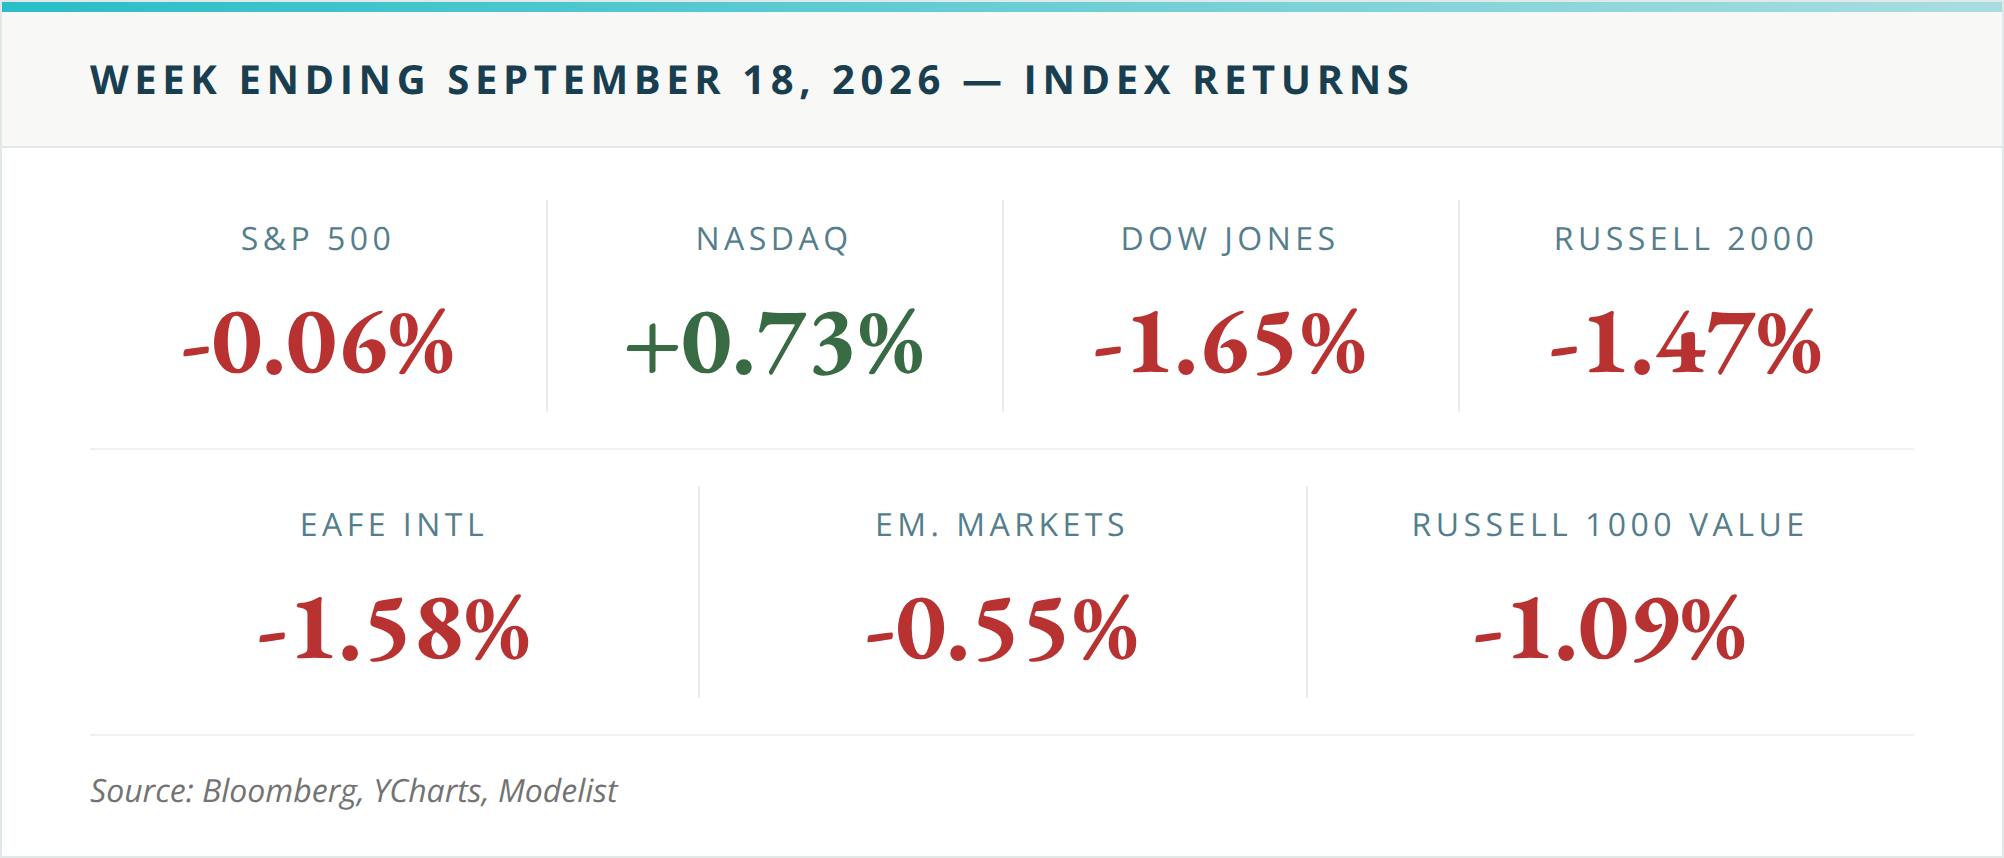
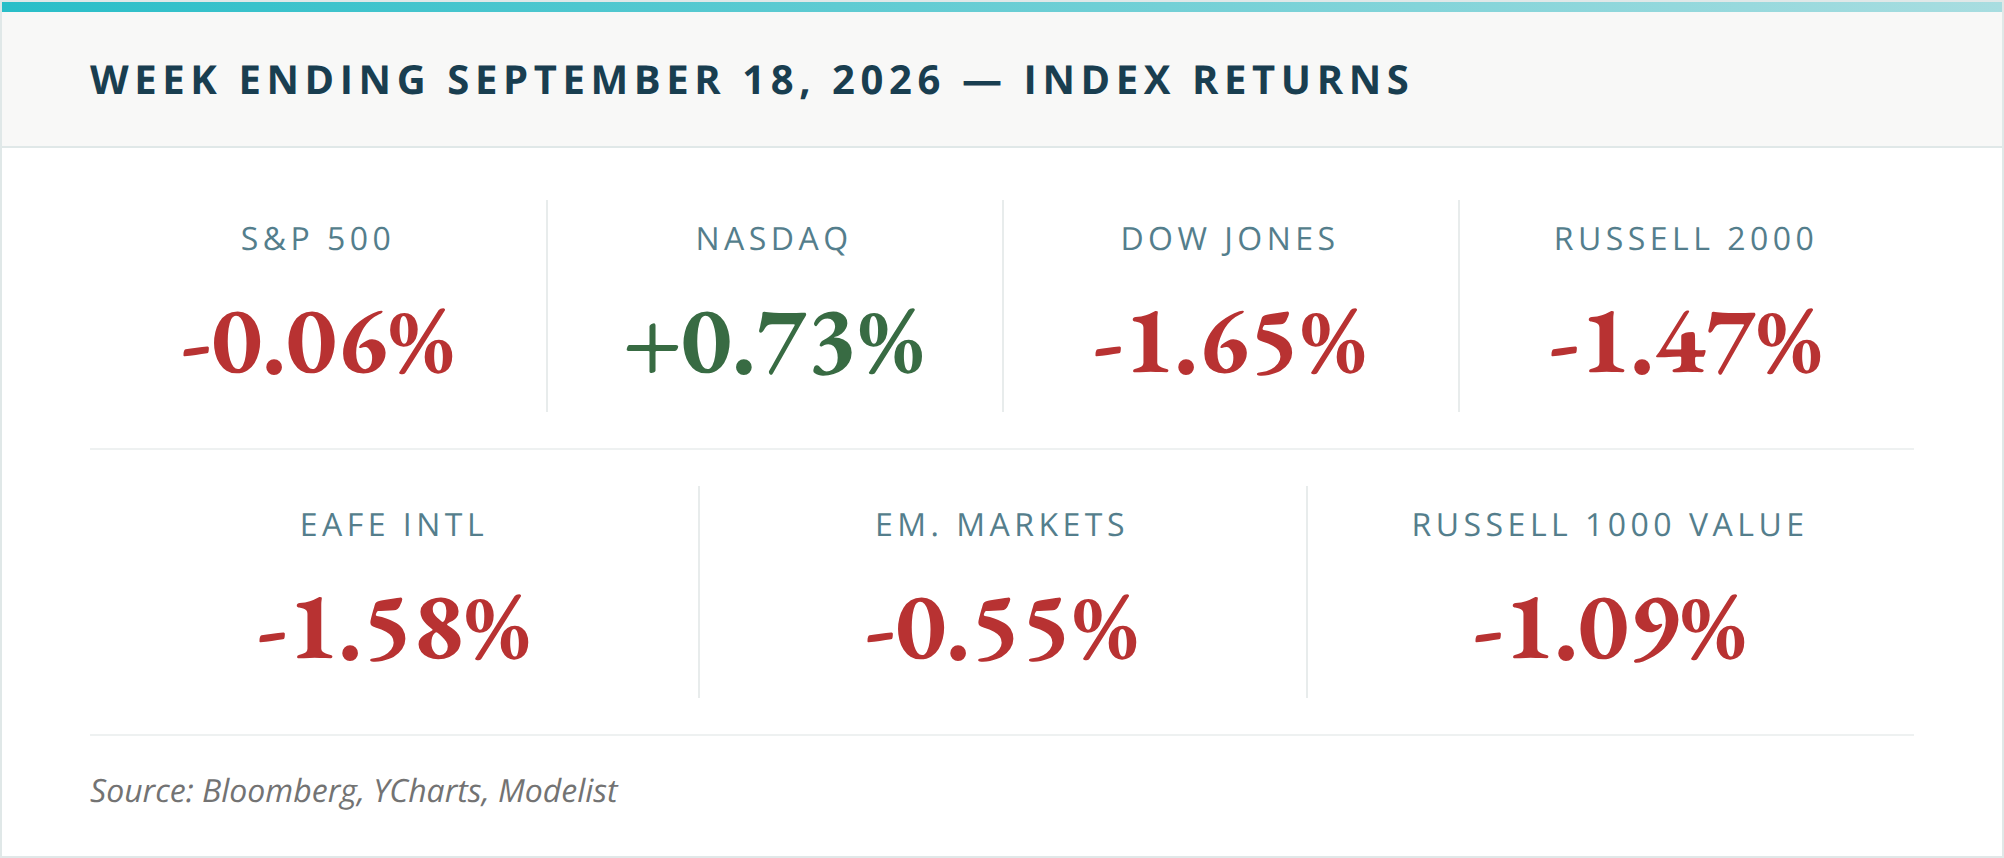
The hike itself was not the surprise. The Fed lifted its target range a quarter point to 3.75%–4.00%, its first increase since 2023, and markets had largely priced it in. The projections that came with it were firmer, pointing to a higher rate path this year and next. The S&P 500 finished essentially flat, down 0.06%, and the Nasdaq rose 0.73%. Underneath those two numbers the week was weaker: eight of the eleven S&P 500 sectors fell, the Dow lost 1.65%, and the Russell 2000 dropped 1.47%.
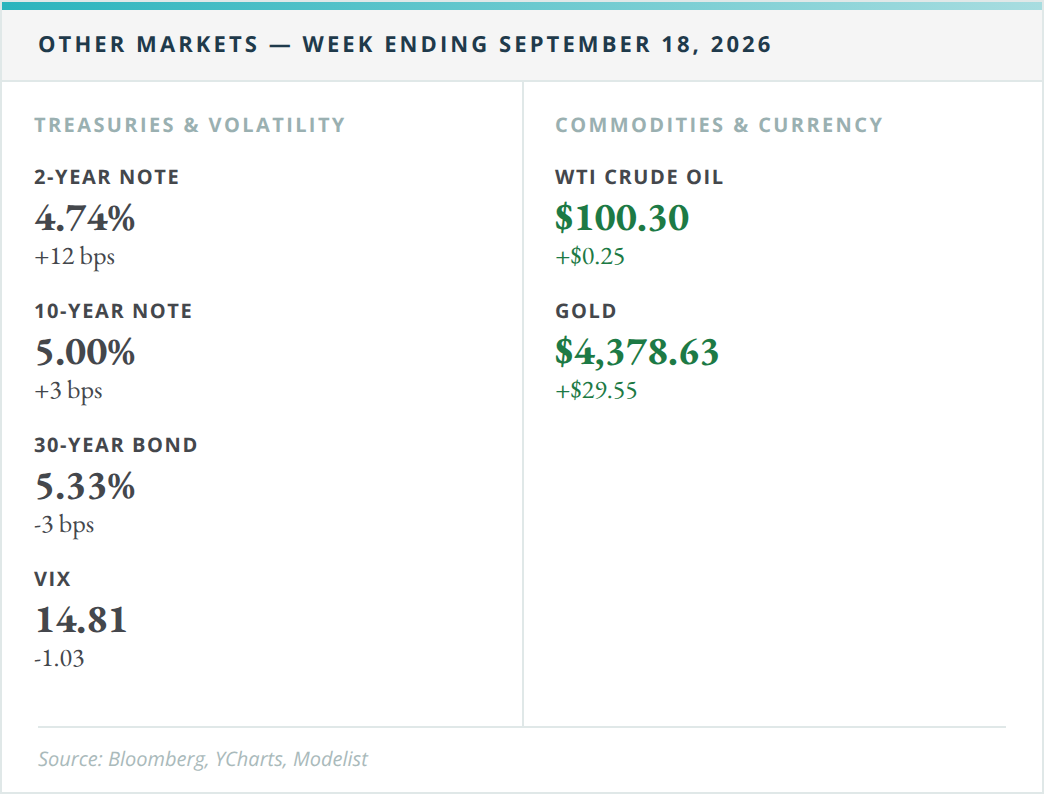
The Treasury market split in two. The 2-year yield, the one most closely tied to where the Fed sets short-term rates, rose 12 basis points to 4.74%. The 10-year barely moved, up 3 basis points to 5.00%. The 30-year went the other way, slipping 3 basis points to 5.33%. A flatter curve like this is usually read as the bond market agreeing that tighter policy now means slower growth later.
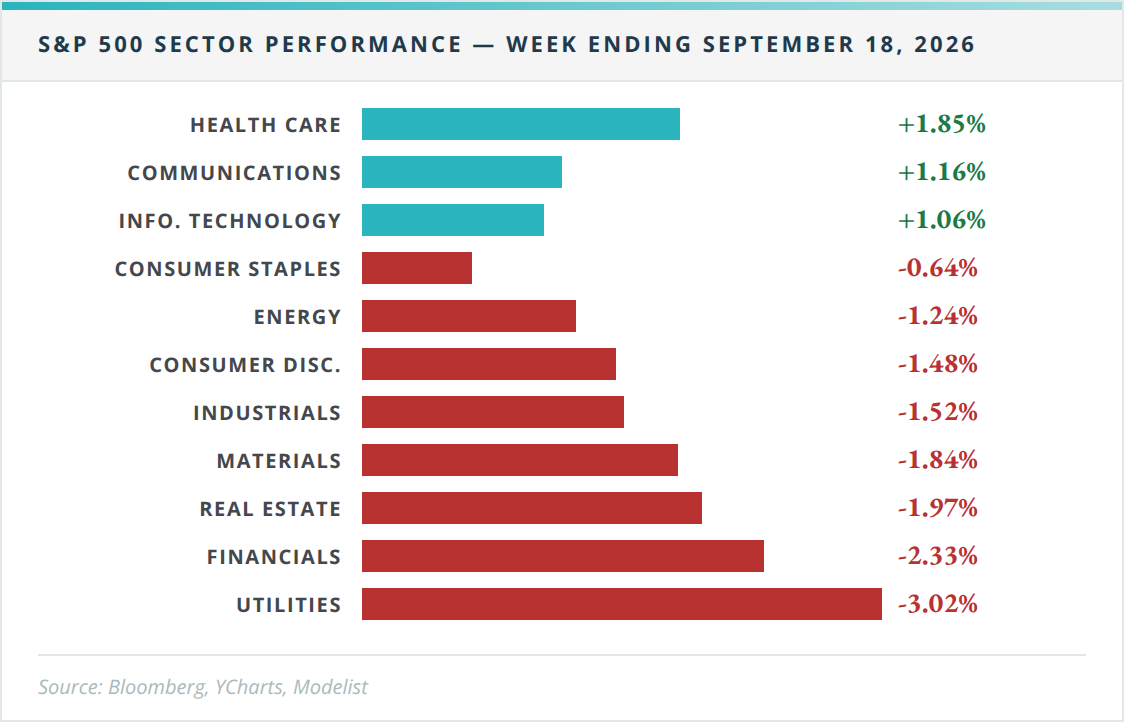
Here is the part that doesn't fit the usual explanation. Utilities and real estate are often called bond proxies — businesses owned largely for steady dividends, whose prices tend to move opposite long-term interest rates. By that logic, a week when the 30-year yield fell should have been a reasonable one for them. Instead, Utilities finished last of the eleven sectors, down 3.02%, and Real Estate fell 1.97%. Financials fell 2.33%, which has a more conventional explanation: when short-term rates rise faster than long-term rates, the spread banks earn between deposits and loans tends to narrow.
One reading, and it is an inference rather than a proven cause: for money that exists to produce income, the relevant competitor this week was the short end of the curve, not the long end. A 2-year Treasury now yields 4.74%. Someone holding utility shares for their income is implicitly choosing that income over what a short-term Treasury pays, and on Wednesday the Fed signaled that the alternative may keep improving. That is a different pressure from the one the bond-proxy label describes, and it doesn't depend on what the 30-year did.
The Defensive Label Flipped in a Week
Last week we noted that Health Care and Utilities, the two sectors most often treated as defensive, were both among the week's worst performers, and that a firmer Fed path could keep that pattern going. The Fed did signal a firmer path. Half of the pattern held. Utilities lagged again. Long bonds did not, and Health Care went from last week's weakest sector, down 3.54%, to this week's strongest, up 1.85%. Two weeks, the same label, opposite results. Defensive describes how a holding has tended to behave, not how it will behave in a given week.
What the market is currently assuming is that the Fed has more to do, and that higher short-term rates will slow the economy enough to keep long-term rates contained. For that to hold, inflation has to cooperate with crude still above $100 a barrel. Friday's final University of Michigan reading, which includes consumers' inflation expectations, is the first data point that tests it.
Want the Full Picture?
For the complete index returns, all 11 sector breakdowns, treasury yields, and commodities data, view the full report below. View Full Weekly Market Report →
What This Means for Your Retirement Plan
For a family that keeps a year or two of spending in short-term holdings, this week quietly improved the yield on that reserve, and in California where the reserve sits changes what it keeps. Interest on Treasury bills and notes is exempt from California income tax; interest from bank CDs and savings accounts is not, and a fund's dividends qualify only when the fund meets a California-specific test for how much it holds in U.S. obligations. The Tax Management Journey® is built to weigh decisions like this across federal and California treatment together, so a higher short-term rate is judged by what it nets after both, not by the rate on the statement.
If the income in your portfolio comes from dividend stocks, cash, and bonds at once, a week like this one moves each of those pieces for a different reason. Whether they were chosen to work together or were added one at a time is a fair question to ask.
Schedule a 20-Minute Due-Diligence Q&A Conversation →