
Higher Rates Should Have Hurt Tech Most Last Week. They Hurt the Income Side of Portfolios Instead.
The 10-year Treasury yield rose 16 basis points last week to 5.16%. The usual rule says rising rates hit hardest at the stocks priced furthest into the future: fast-growing companies whose value rests on earnings years away. Those stocks led the market. The holdings people own for their income gave ground instead.
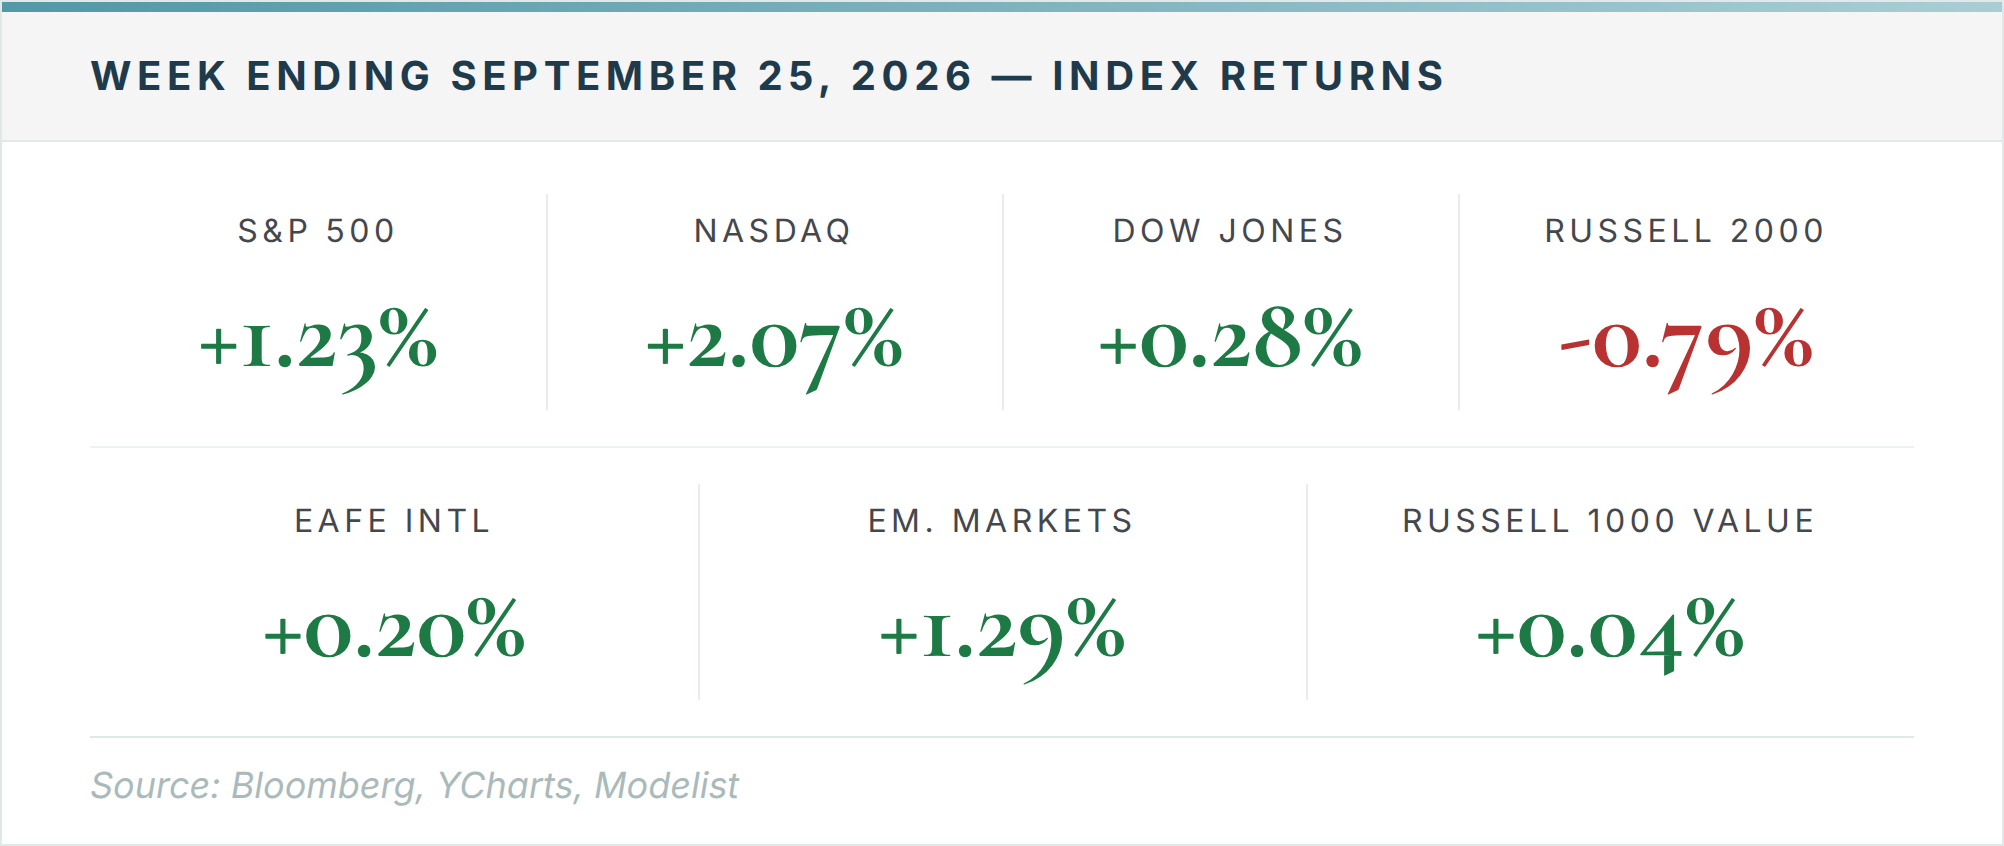
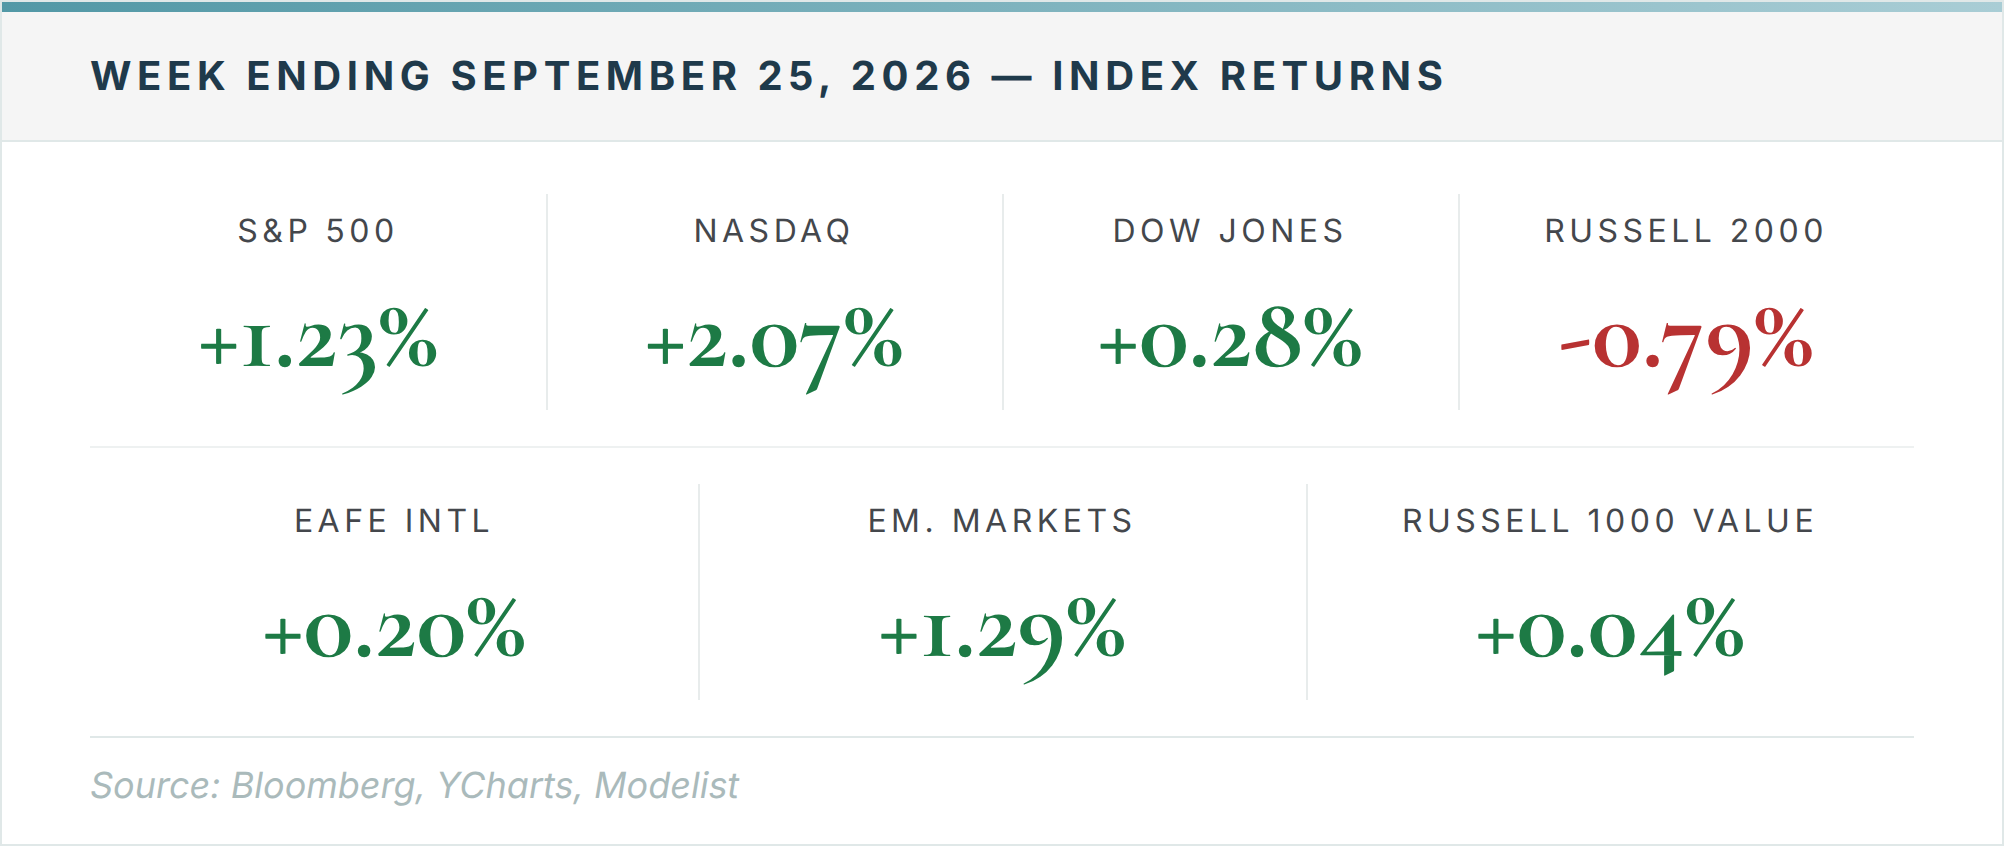
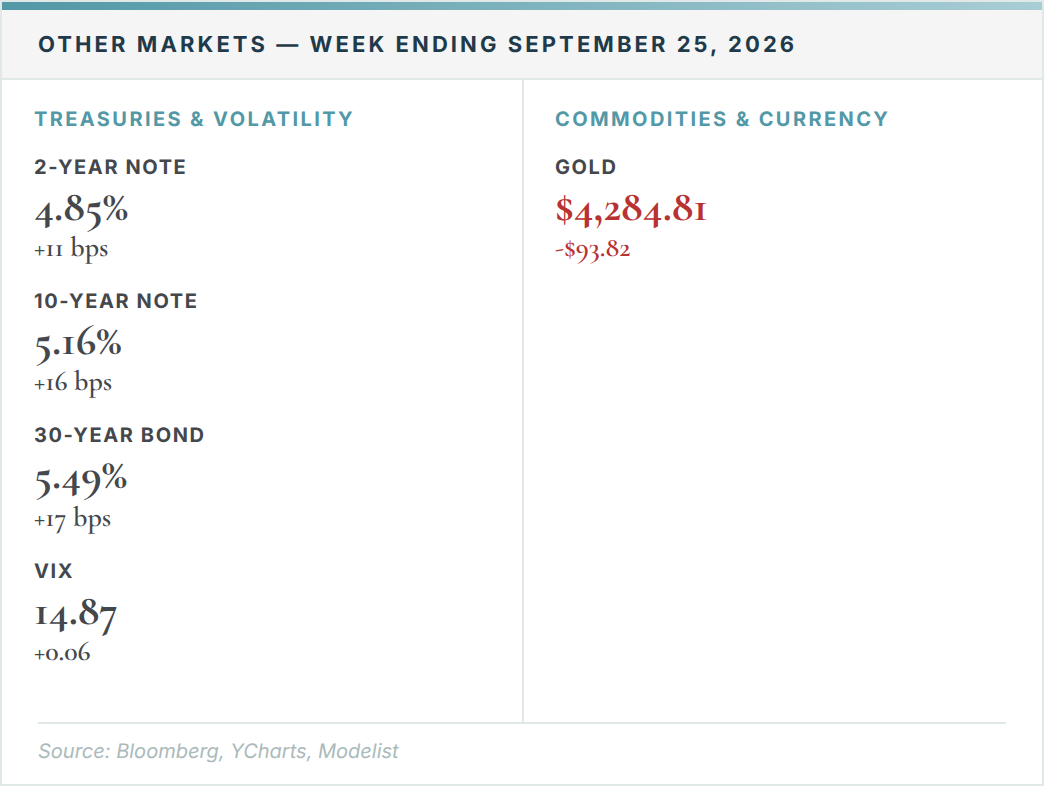
The move in rates came from economic data, not from the Fed. S&P Global's flash September readings on business activity came in at 57.0 for manufacturing and 58.7 for services, both well above forecasts, and initial jobless claims stayed low at 197,000. Yields rose across the curve: the 2-year by 11 basis points to 4.85% and the 30-year by 17 to 5.49%. Stocks rose with them. The S&P 500 gained 1.23% and the Nasdaq 2.07%.
The Stocks Most Exposed to Rates Led Anyway
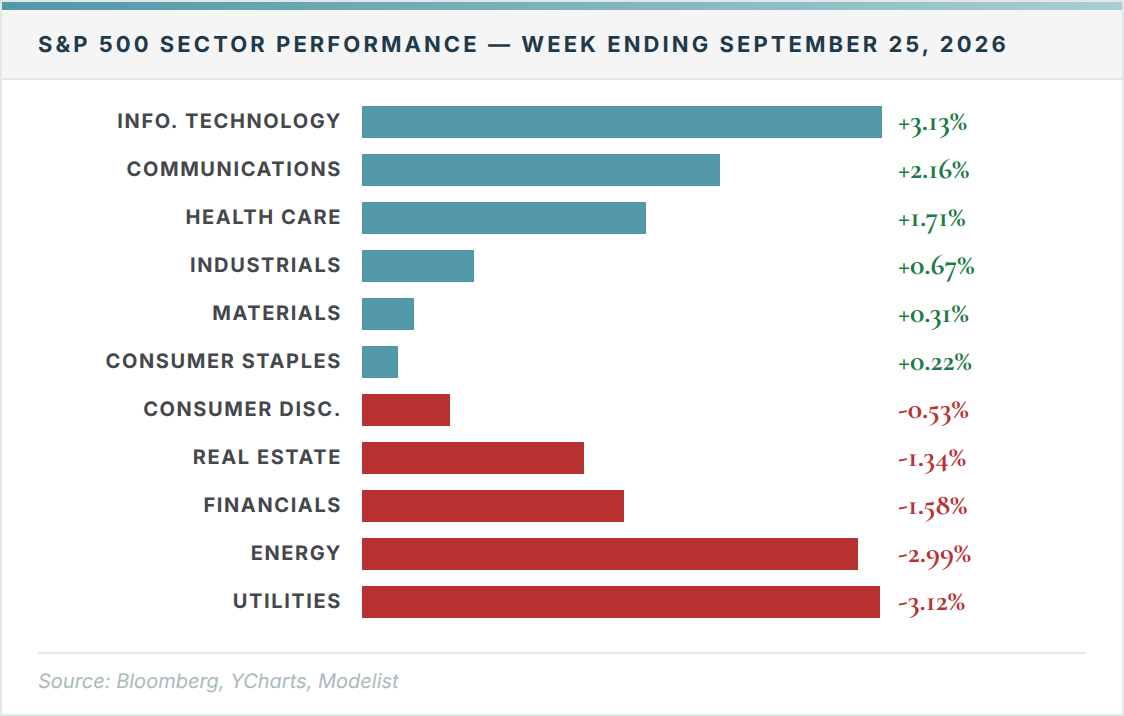
Information Technology gained 3.13% and Communication Services 2.16%, the two best of the eleven S&P 500 sectors. By the textbook, these are the sectors a higher discount rate should hurt most, because so much of their value sits in earnings expected later. One reading, and it is an inference rather than a proven cause: the same data that pushed yields up is also evidence of demand for what these companies sell, and last week the earnings story outweighed the rate story.
The Rate Hit Landed on Income
The bottom of the table tells a different story. Utilities fell 3.12%, last of the eleven sectors, and Real Estate fell 1.34%. Both are owned largely for steady dividends. The Bloomberg U.S. Aggregate bond index lost 0.82% in a week the S&P 500 rose 1.23%. Energy fell 2.99%, though that decline tracked crude oil more than interest rates.
Last week, Utilities also finished last, down 3.02%, and we read that as income-seeking money competing with short-term Treasuries after the Fed's hike. In that week only the short end of the curve rose; the 30-year yield actually fell. This week the long end rose more than the short end. Two opposite rate patterns, and Utilities finished last both times. That strengthens last week's reading. The pressure on income holdings doesn't appear tied to one point on the curve. With Treasuries paying between 4.85% and 5.49% from two years out to thirty, dividend payers are competing with them across the whole curve.
Three weeks ago, long-term bonds fell harder than stocks. Last week the bond index fell while stocks rose. Twice in three weeks, the holdings expected to steady a portfolio lost more than its stocks did.
What the Market Is Assuming Now
The market is currently pricing an economy strong enough to carry a 10-year yield above 5% while company earnings keep rising. One thing that has to stay true for that is inflation not picking back up. This week brings the first tests of that assumption. Core PCE, the Fed's preferred inflation gauge, arrives Wednesday, with forecasters expecting 3.3% year over year. The September jobs report follows Friday, where forecasters expect payroll growth of 90,000 and unemployment at 4.1%. Higher rates are already reaching households directly: the 30-year mortgage rate stood at 7.03%, up from 6.30% a year earlier.
Want the Full Picture?
For the complete index returns, all 11 sector breakdowns, Treasury yields, and commodities data, view the full report below.
View Full Weekly Market Report →
What This Means for Your Retirement Plan
A week when the growth side of a portfolio rises and the income side falls is the week it matters where next year's spending comes from. The Bucket Plan® separates money by when it will be needed, and the near-term segments are replenished from the long-term ones over time. That structure gives the plan a choice in a week like this one: the refill can come from what rose, instead of selling what fell to cover the next withdrawal.
If your income holdings lost ground in a week the market gained, it's worth knowing whether your withdrawals are set to draw from whatever happens to be up, or from whatever the account was built to sell. Those are different plans, even when the statements look alike.
Schedule your 20-Minute Due-Diligence Q&A Conversation →