
Long-Term Bonds Fell Harder Than Stocks This Week. The Cushion Didn't Cushion.
A balanced retirement portfolio runs on one quiet assumption: when stocks have a rough week, bonds are the part that doesn't. This week broke that assumption. The holdings meant to fall less than stocks fell more than stocks did — for a reason worth understanding before the next version of this week shows up.
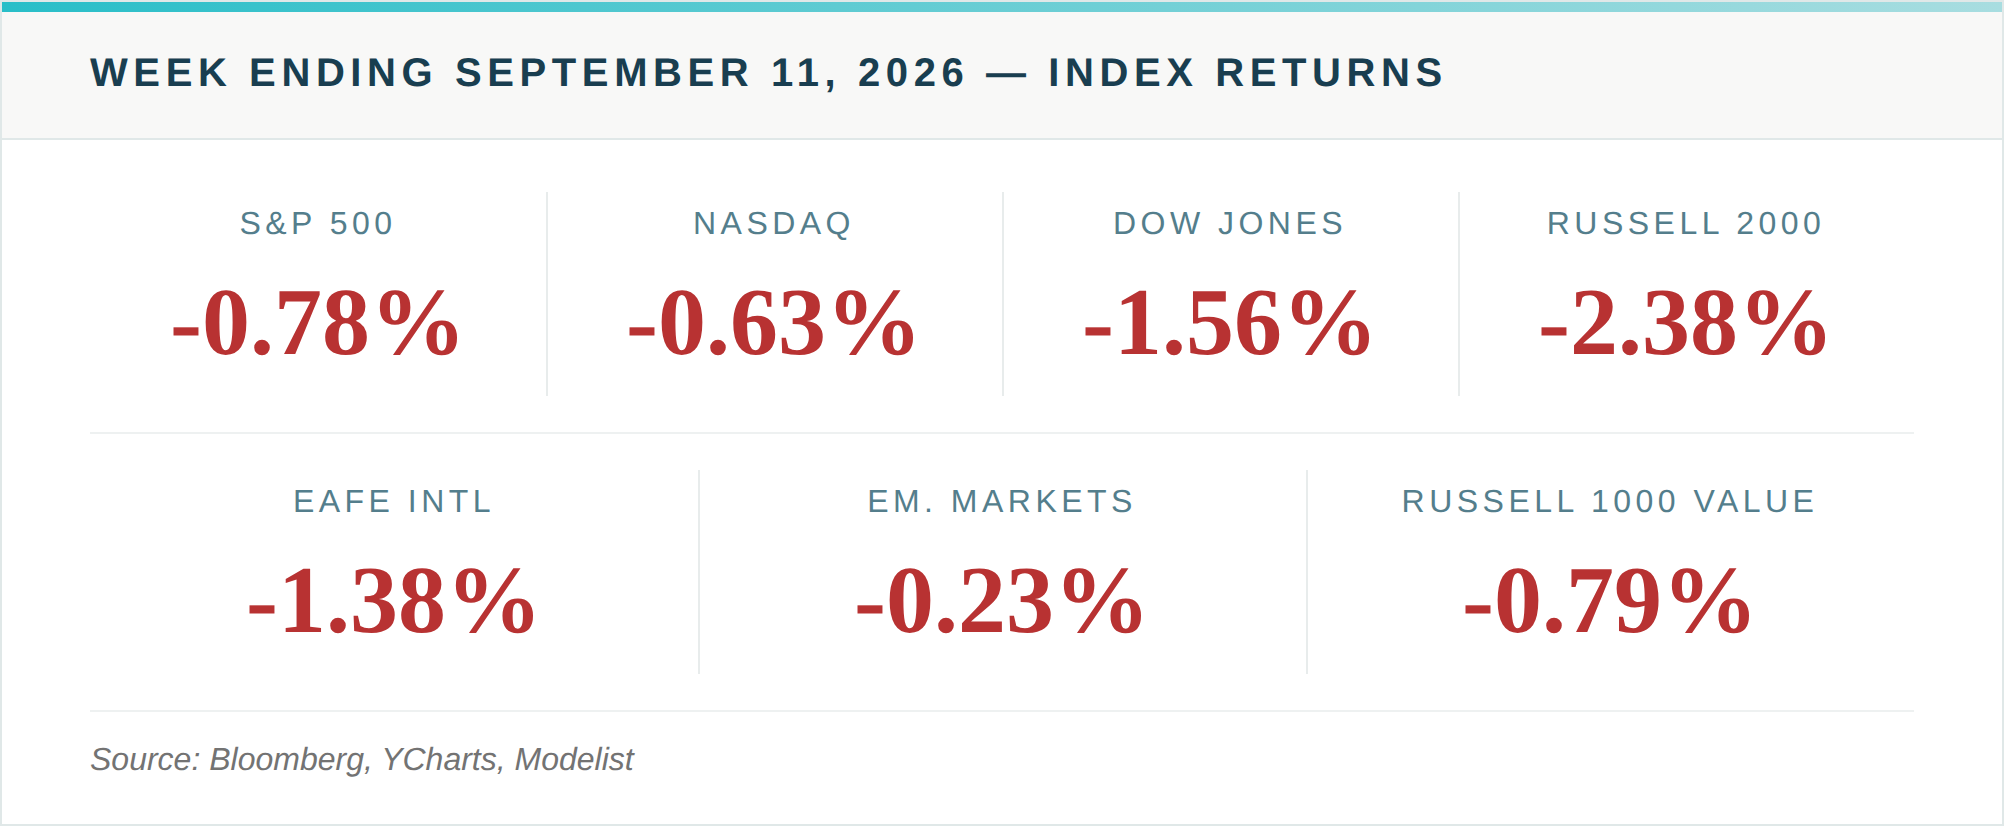
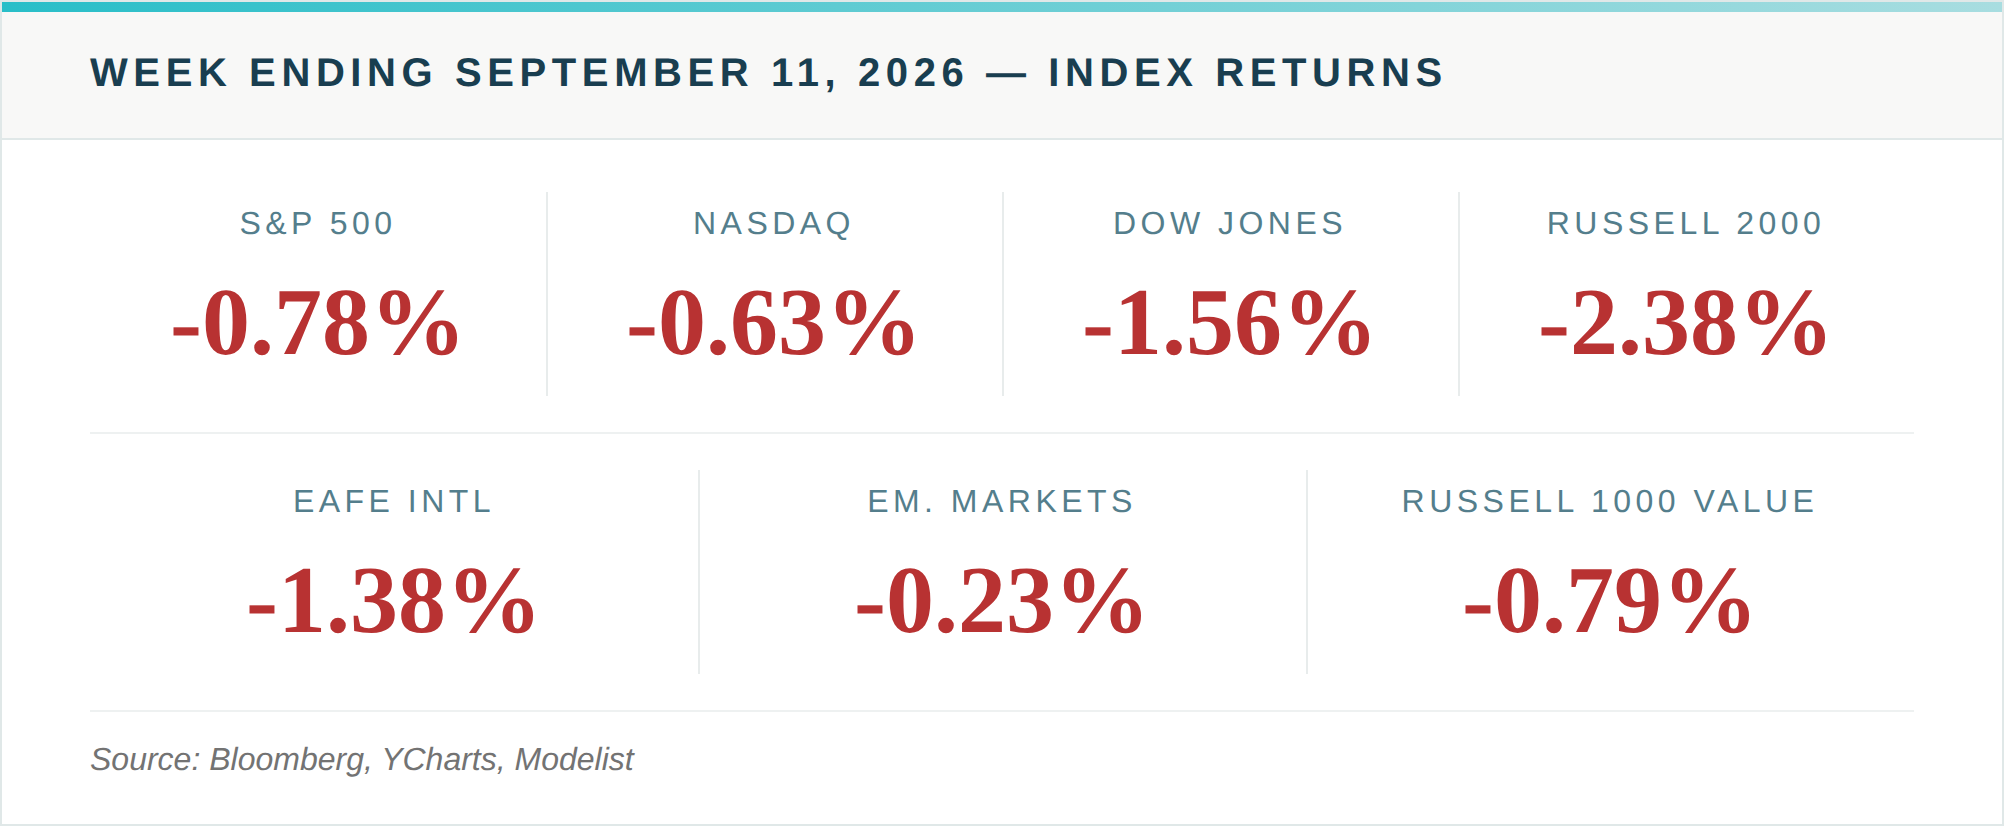
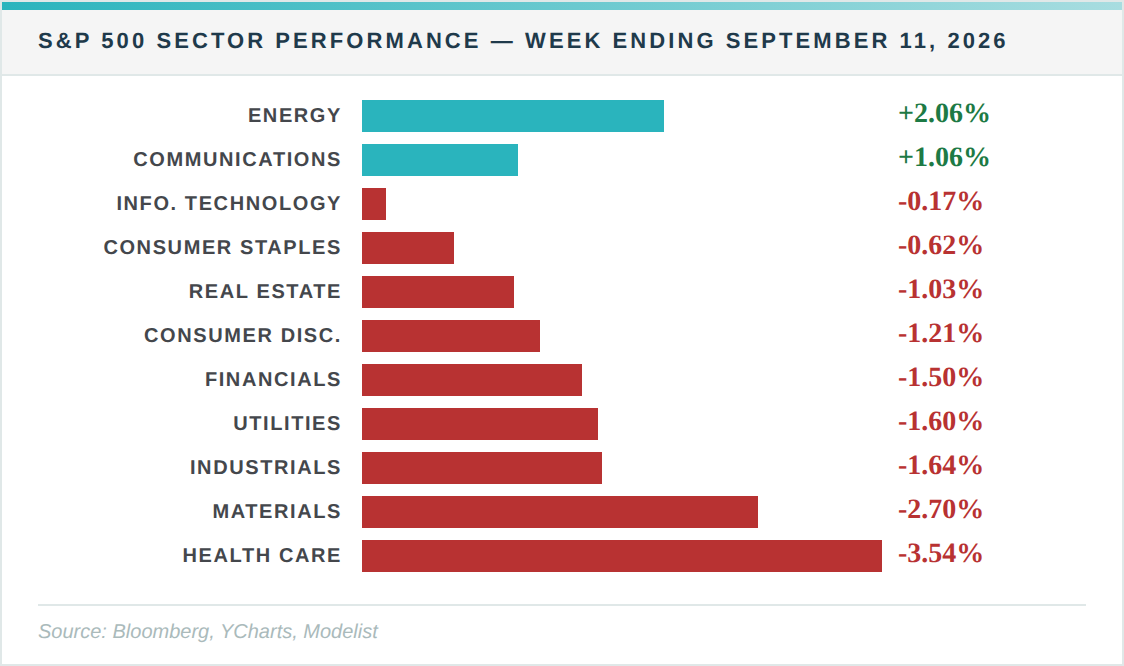
Stocks slipped, but not sharply. The S&P 500 lost 0.78%, the Dow fell 1.56%, and the Nasdaq gave back 0.63%. Small caps took the worst of it — the Russell 2000 dropped 2.38% — while the Russell 1000 Value fell 0.79%. Only two of the eleven S&P sectors finished the week higher: Energy, up 2.06% as crude climbed above $100 a barrel, and Communication Services, up 1.06%. Health Care led the declines, down 3.54%, followed by Materials at negative 2.70%. Overseas, the losses were broader — EAFE fell 1.38%, with Switzerland, Germany, and Australia each down more than 2% while Japan held roughly flat, and emerging markets fell a smaller 0.23% as gains in Brazil and Thailand offset a sharp drop in China.
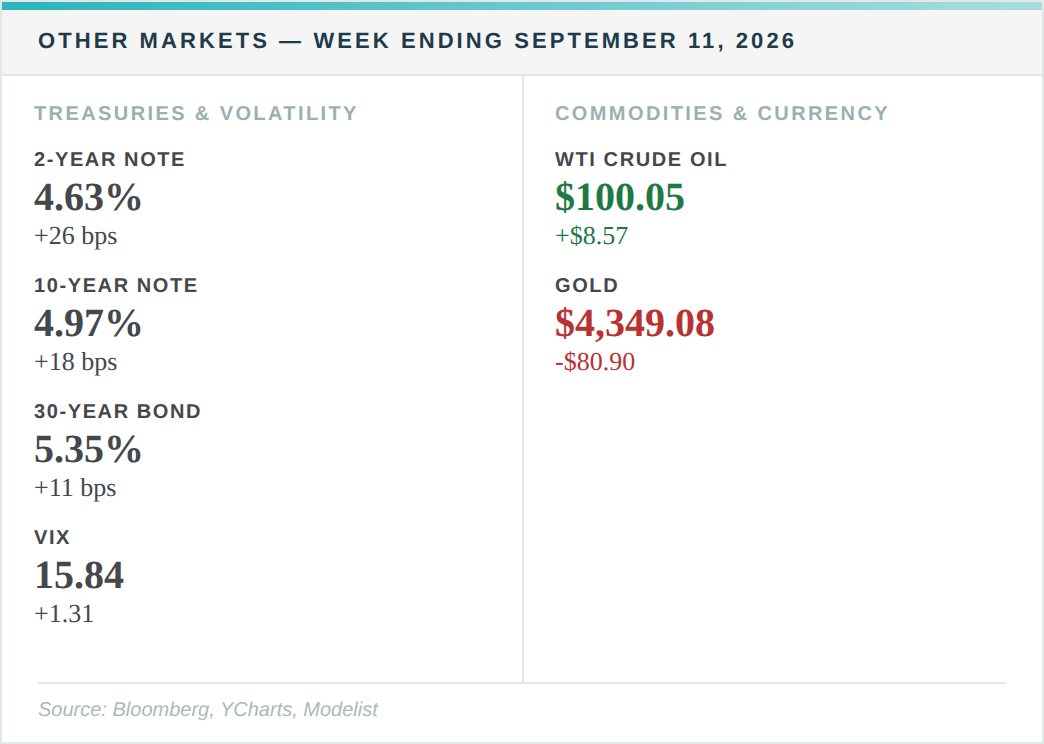
Bonds are where the week actually got interesting. A hot batch of inflation data pushed yields higher across the curve: the 2-year Treasury yield jumped 26 basis points to 4.63%, the 10-year rose 18 basis points to 4.97%, and the 30-year climbed 11 basis points to 5.35%. The broad Bloomberg U.S. Aggregate bond index fell 1.04% for the week. Long-term Treasuries fell even further — a steeper decline than the S&P 500 posted over the same five days. Short-term Treasury bills, by contrast, barely moved. That's not a coincidence. A bond's price sensitivity to a rate move is a direct function of how long it has left until maturity, and this week is a clean illustration of what that means in practice: the longer the bond, the harder it fell.
The inflation data driving this was itself worth a second look. August core CPI rose 0.3% on the month — a touch hotter than expected — leaving annual inflation at 3.4% headline and 2.4% core. Producer prices rose 5.4% year-over-year, also above forecast. The sharper signal came from sentiment: the University of Michigan's preliminary September reading fell to 47.8 from 51.7, as consumers' year-ahead inflation expectations jumped to 4.6%. Markets read all of this as reason to pare back expectations for rate cuts, and priced it directly into the long end of the curve.
That same rate story explains the sector pattern better than "stocks were weak" does. Health Care and Utilities are the two sectors most often treated as defensive — steady dividends, bond-like cash flows — and both were among the week's worst performers, down 3.54% and 1.60% respectively. The two sectors that rose had nothing to do with defensiveness; they had a direct, identifiable reason tied to the week's news. Energy tracked oil. Communication Services wasn't exposed to the rate story the way rate-sensitive sectors were.
The Federal Reserve meets Wednesday, and markets expect rates to hold. But the question isn't whether the Fed moves this week — it's how much easing officials still project after a week of firmer-than-expected inflation data. If the path they signal is higher than what markets had priced, this week's dynamic — yields up, long bonds and defensive stocks both lagging — doesn't necessarily end when the week does.
Want the Full Picture?
For the complete index returns, all 11 sector breakdowns, treasury yields, and commodities data, view the full report below. View Full Weekly Market Report →
What This Means for Your Retirement Plan
The lesson from this week isn't "avoid bonds." It's that "safe" isn't a property of an asset class — it's a property of how that asset lines up with when you'll actually need the money. A 30-year Treasury and a 3-month Treasury bill are both government debt, but they behaved nothing alike this week, because one of them has decades of interest-rate risk built into its price and the other has almost none. This is the exact reasoning behind a Bucket Plan® approach: money needed in the next year or two sits in short-duration holdings — the kind that barely moved this week — while money with a longer runway can carry the price swings that come with a long-term bond or a stock, because there's time to let a bad week pass.
If it's been a while since anyone walked you through how the bond portion of your own portfolio is actually built — not just how much you hold, but how long its duration runs and what it's positioned to do for you in a week like this one — that's a reasonable thing to ask about. Schedule a 20-Minute Due-Diligence Q&A Conversation →