
Long-Term Rates Rose Again Last Week. This Time Your Income Holdings Rose With Them.
Three weeks ago, rising long-term yields were the stated reason Utilities and Real Estate sold off. Two weeks ago yields fell across the entire curve and those same sectors sold off anyway. Last week long-term yields rose again, and both finished higher.
The Test Came Back Clean
Last week's commentary said the market's calm had a test date on it. CPI landed Wednesday and PPI Thursday, and both came in on the cool side. Consumer prices matched forecasts. Producer prices came in below them. Concern about another Fed increase in September eased over the course of the week.
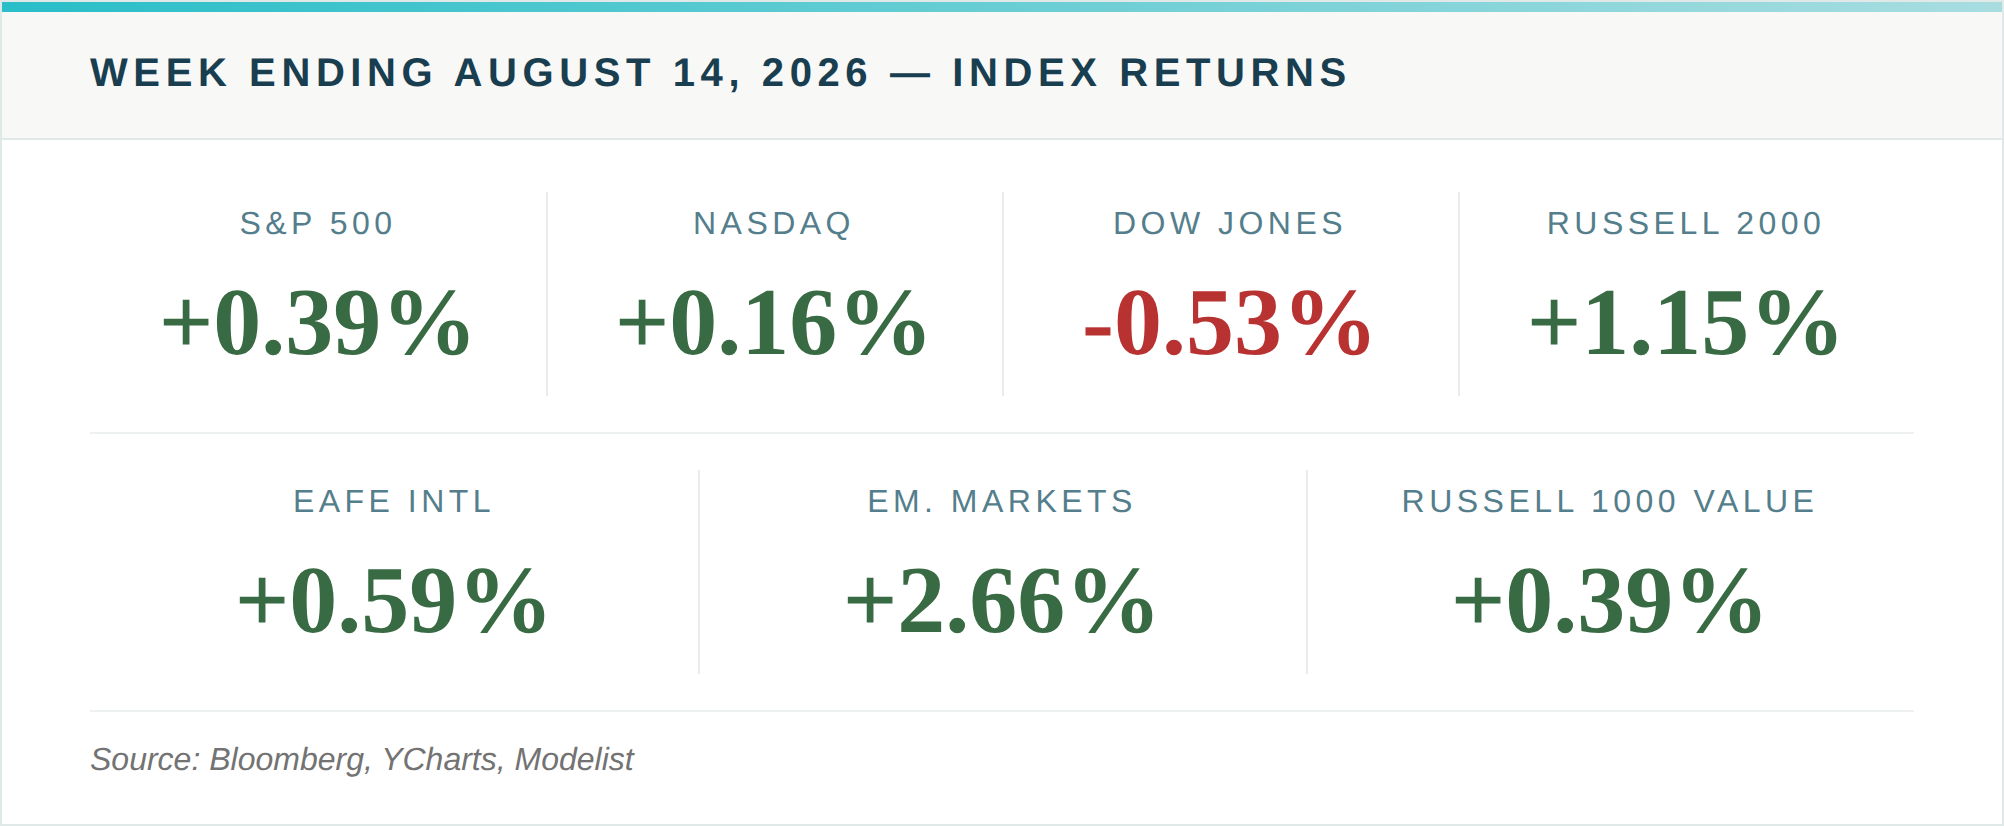
The equity response to getting exactly what it wanted was close to nothing. The S&P 500 gained 0.39%. The NASDAQ added 0.16%. The Dow finished down 0.53%.
Eight Sectors Higher, and the Index Barely Moved
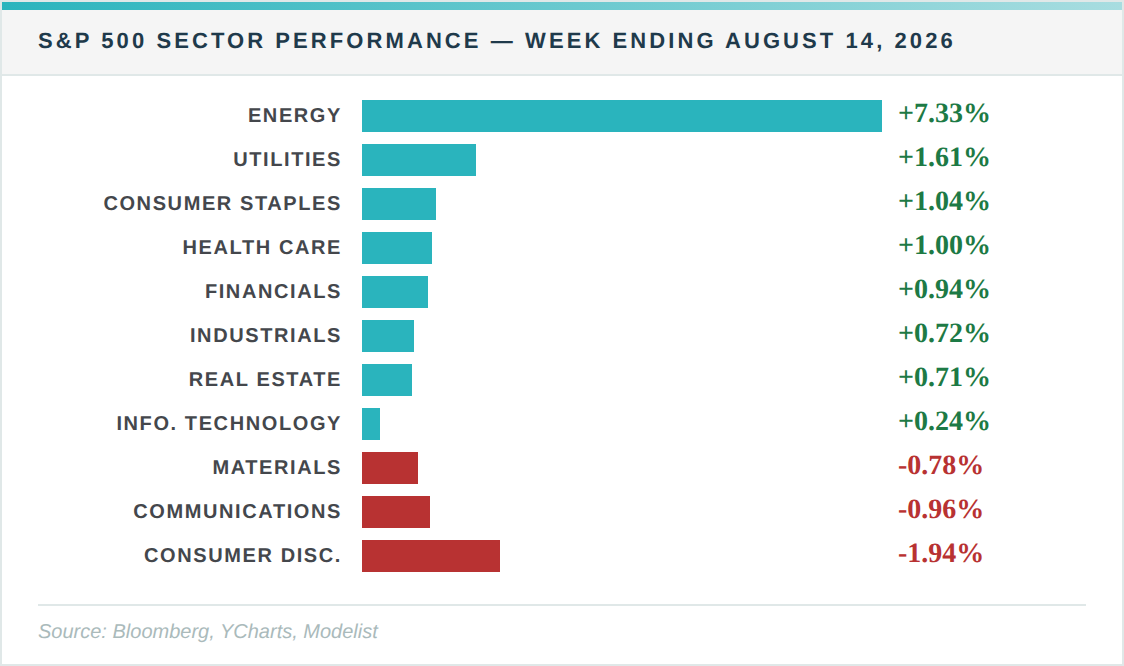
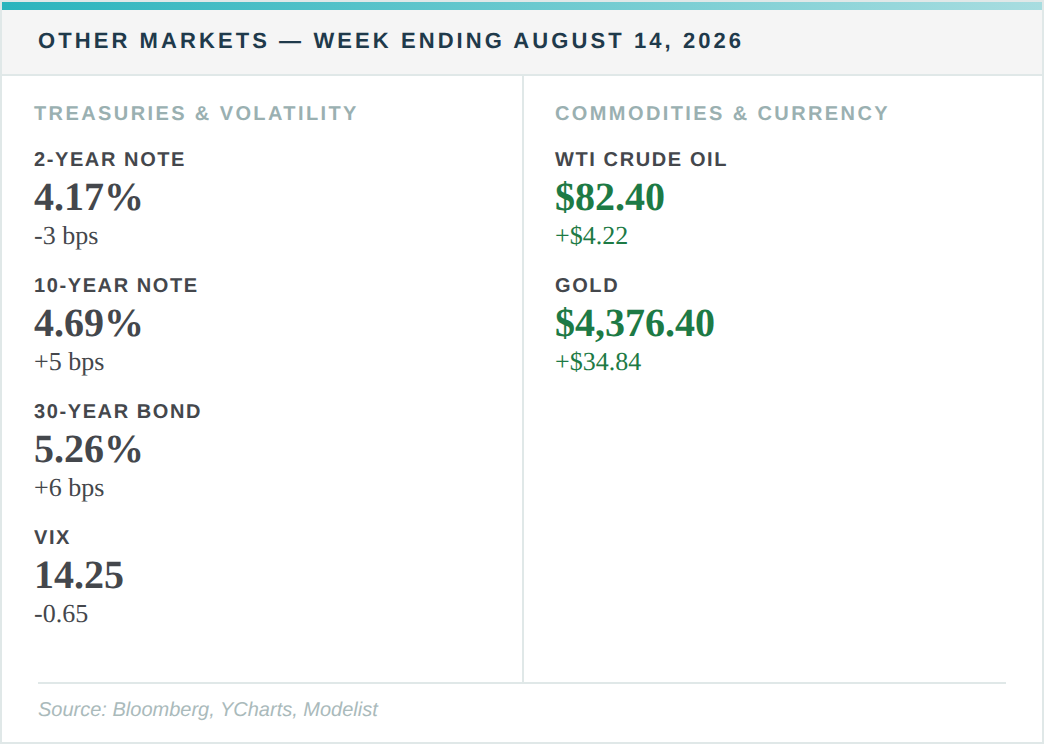
Eight of the eleven S&P 500 sectors finished the week in positive territory, and the index still only managed 0.39%. Energy did most of the lifting, rising 7.33% as crude gained $4.22 to close at $82.40 a barrel. No other sector cleared 1.61%.
The three that fell were Consumer Discretionary at 1.94%, Communications at 0.96%, and Materials at 0.78%. The first two carry enough weight to cancel out a great deal of good news underneath them. Retail Sales and consumer sentiment both came in below expectations the same week, which is the household spending picture the Consumer Discretionary number is describing.
There is something worth sitting with in the sector that carried the week. Energy rose because oil rose. Oil is a direct input to the inflation readings the market spent Wednesday and Thursday celebrating.
The Front End Listened. The Long End Did Not.
The 2-year Treasury yield fell 3 basis points to 4.17%. That is the part of the curve that moves with Fed expectations, and it behaved the way cooler inflation would suggest. Small caps agreed with it. The Russell 2000 gained 1.15%, ahead of the S&P 500, the NASDAQ, and the Dow. Smaller companies tend to carry more floating-rate and short-dated debt, so easing pressure at the front of the curve reaches them first. That part of the week is coherent.
The 10-year rose 5 basis points to 4.69%. The 30-year rose 6 basis points to 5.26%. In a week when the data broke the market's way on both inflation reports, cooling prices bought relief at the short end of the curve and none at all at the long end.
Which returns us to the sectors we opened with. Utilities finished up 1.61%, second best on the board. Real Estate rose 0.71%. Both recovered in a week when the long-term rates that supposedly govern them went up.
Set the three weeks side by side. Rates up, income sectors down. Rates down, income sectors down. Rates up, income sectors up. The relationship held once and inverted twice. Three weeks is not a data set. It is enough to notice that the explanation everyone agreed on did not do much explaining.
Want the Full Picture?
For the complete index returns, all 11 sector breakdowns, treasury yields, and commodities data, view the full report below.
View Full Weekly Market Report →
What This Means for Your Retirement Plan
A plan that needed the rate call to be right would have been wrong twice in the last three weeks. That is the practical argument for coordination over conviction, and it is the reason the CRAve Life Advisory Process℠ is built so that no single view of interest rates has to carry a household's retirement income. Each piece is sized and sequenced against what it is actually responsible for funding, which is what allows a week like this one to change what your statement says without changing what you are able to spend. The money you need in the next few years is not supposed to be riding on where the 30-year finishes, and the money you will not touch for two decades is not supposed to be scared off by it.
If you are holding long-dated bonds or income-oriented equities and could not say quickly which part of your plan they are funding, that is a question better answered before the next round of data than after it. A short conversation is usually enough to find out whether the answer exists.
Schedule a 20-Minute Due-Diligence Q&A Call →