facebook twitter instagram linkedin google youtube vimeo tumblr yelp rss email podcast phone blog search brokercheck brokercheck Play Pause
Record-Setting Weather Thumbnail

Record-Setting Weather

The Markets

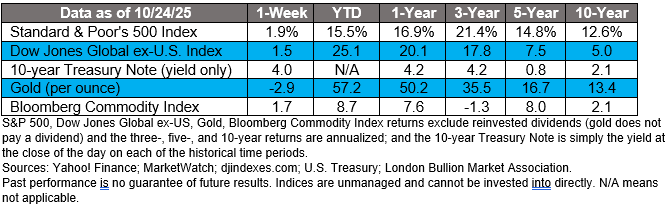
Stock markets celebrated, but bond markets were cautious.

Last week, the Consumer Price Index (CPI) showed that inflation for September was lower than economists had anticipated. Both headline and core inflation (the latter excludes volatile food and energy prices) rose 3.0 percent year over year.

“While the September figure is still a full percentage point above the Fed’s 2 [percent] target—and the highest level of inflation seen since January—it signals that the path of price growth is modest enough to allow for additional rate cuts,” reported Megan Leonhardt of Barron’s.

Investors had been concerned that a jump in inflation might cause the Federal Reserve (Fed) to stop lowering the federal funds rate. The better-than-expected inflation report gave markets confidence the Fed will continue to lower the fed funds rate this year.

Stock markets hit new records

Markets rose after the CPI was released. “The Dow Jones Industrial Average closed north of 47,000 for the first time on Friday…The Dow hit its second thousand-point milestone of 2025 after crossing the 46,000 threshold 31 trading days ago, according to Dow Jones Market Data. The S&P also notched its best week since Aug. 8,” reported Connor Smith of Barron’s.

United States Treasuries rallied following the inflation news, too, but retreated after S&P Global released the Flash US Composite PMI® Output Index, reported Ye Xie of Bloomberg. The Index provides information about the state of U.S. manufacturing and services. A reading above 50 signals economic expansion, while a number below 50 suggests contraction. 

In October, the preliminary composite reading was 54.8, a three-month high and well above September’s 53.9 reading. Indexes measuring activity in the manufacturing and services sectors both accelerated from September to October.

Faster growth is good news; however, bond investors recognized that it could affect the Fed’s rate-cut decisions. The Fed lowers the federal funds rate to stimulate the economy. If the business activity is growing, stimulus may be unnecessary.

Social Security benefits will be higher in 2026

CPI data was calculated, despite the government shutdown, because it is required to determine the cost-of-living increase for Social Security. In 2026, benefits will be 2.8 percent higher, the equivalent of about $56 per month on average, according to the Social Security Administration blog.

By the end of the week, major U.S. stock indexes were higher. Yields on many U.S. Treasuries with longer maturities moved higher over the week.


Record-Setting Weather

For more than a decade, the National Oceanic and Atmospheric Administration kept a database that tracked weather and climate-related events that caused more than one billion dollars of damage. When the government discontinued the database in May of this year, a non-profit organization continued the work, reported Lauren Rosenthal of Bloomberg.

From 1980 through June 2025, the U.S. experienced 417 severe weather events that cost a billion dollars or more. The total cost of all these events combined was about $3.1 trillion, according to the data. (In human terms, the cost was more than 17,000 deaths.)

Over the first six months of this year, there were 14 events that did more than $101 billion worth of damage. It was a new record. The weather events included:


Event

Cost

January

  • Wildfires in Los Angeles

$61.2 billion

February

  • Storms and tornadoes across the Southeast

1.6 billion

March

  • Severe storms across Southern and Central U.S.

1.4 billion


  • More than 180 tornadoes across many states in the Central, Southeastern, and Eastern U.S.

10.6 billion


  • Severe hailstorms in north Texas followed by extreme rainfall and flooding in south Texas.

1.2 billion


  • Tornadoes, damaging winds, and large hail across the North Central U.S.

1.9 billion

April

  • Severe storms, tornadoes, and flooding from the mid-Mississippi Valley into the Ohio Valley

4.3 billion


  • Severe storms and tornadoes across portions of Nebraska, Kansas, Oklahoma, Texas, Iowa, and Missouri

2.4 billion


  • Severe storms, high winds, damaging hail, and tornadoes from Texas to New England

1.9 billion

May

  • 60 confirmed tornadoes across the Central and Eastern U.S. 

5.9 billion


  • A tornado outbreak across the Central and Southeastern U.S. 

2.6 billion


  • Severe storms across southern states, including Texas, Oklahoma, Louisiana, and Mississippi 

1.2 billion

June

  • Severe storms and tornadoes in the Southeastern and Central U.S. 

2.4 billion


  • High winds, hail, and isolated tornadoes in North Central and Northeastern states 

2.8 billion

 
These events are causing homeowners insurance costs to increase. “Extreme weather events such as hurricanes, wildfires, and floods are becoming more frequent and more destructive, causing more property losses than home insurance providers can afford to cover… Insured property losses caused by weather catastrophes now routinely approach $100 billion per year, according to data from the Insurance Information Institute,” reported Catriona Kendall of U.S. News & World Report.


Weekly Inspiration

“A change in the weather is sufficient to recreate the world and ourselves.”

 –Marcel Proust, Novelist 

Best Regards,
California Retirement Advisors


Investment advisory services offered through Mutual Advisors, LLC DBA California Retirement Advisors, a SEC registered investment advisor. Securities offered through Mutual Securities, Inc., member FINRA/SIPC. Mutual Securities, Inc. and Mutual Advisors, LLC are affiliated companies. CA Insurance license #0B09076. This content is developed from sources believed to be providing accurate information and provided by California Retirement Advisors. It may not be used for the purpose of avoiding any federal tax penalties. Please consult legal or tax professionals for specific information regarding your individual situation. The opinions expressed and material provided are for general information and should not be considered a solicitation for the purchase or sale of any security. California Retirement Advisors, nor any of its members, are tax accountants or legal attorneys and do not provide tax or legal advice. For tax or legal advice, you should consult your tax or legal professional.
The information being provided is strictly as a courtesy. When you click on any of the links provided here, you are leaving this website and viewing information provided by a third party. We make no representation as to the completeness or accuracy of information provided by any third-party website. Nor is the company liable for any direct or indirect technical or system issues or any consequences arising out of your access to, or your use of third-party technologies, websites, information and programs made available through this website. By accessing these calculators, you assume total responsibility and risk for your use of the third-party website.
* These views are those of Carson Coaching, not the presenting Representative, the Representative’s Broker/Dealer, or Registered Investment Advisor, and should not be construed as investment advice.
* Government bonds and Treasury Bills are guaranteed by the U.S. government as to the timely payment of principal and interest and, if held to maturity, offer a fixed rate of return and fixed principal value.  However, the value of fund shares is not guaranteed and will fluctuate.
* Corporate bonds are considered higher risk than government bonds but normally offer a higher yield and are subject to market, interest rate and credit risk as well as additional risks based on the quality of issuer coupon rate, price, yield, maturity, and redemption features.
* The Standard & Poor's 500 (S&P 500) is an unmanaged group of securities considered to be representative of the stock market in general. You cannot invest directly in this index.
* All indexes referenced are unmanaged. The volatility of indexes could be materially different from that of a client’s portfolio. Unmanaged index returns do not reflect fees, expenses, or sales charges. Index performance is not indicative of the performance of any investment. You cannot invest directly in an index.
* The Dow Jones Global ex-U.S. Index covers approximately 95% of the market capitalization of the 45 developed and emerging countries included in the Index.
* The 10-year Treasury Note represents debt owed by the United States Treasury to the public. Since the U.S. Government is seen as a risk-free borrower, investors use the 10-year Treasury Note as a benchmark for the long-term bond market.
* Gold represents the 3:00 p.m. (London time) gold price as reported by the London Bullion Market Association and is expressed in U.S. Dollars per fine troy ounce. The source for gold data is Federal Reserve Bank of St. Louis (FRED), https://fred.stlouisfed.org/series/GOLDPMGBD228NLBM.
* The Bloomberg Commodity Index is designed to be a highly liquid and diversified benchmark for the commodity futures market. The Index is composed of futures contracts on 19 physical commodities and was launched on July 14, 1998.
* The DJ Equity All REIT Total Return Index measures the total return performance of the equity subcategory of the Real Estate Investment Trust (REIT) industry as calculated by Dow Jones.
* The Dow Jones Industrial Average (DJIA), commonly known as “The Dow,” is an index representing 30 stock of companies maintained and reviewed by the editors of The Wall Street Journal.
* The NASDAQ Composite is an unmanaged index of securities traded on the NASDAQ system.
* International investing involves special risks such as currency fluctuation and political instability and may not be suitable for all investors. These risks are often heightened for investments in emerging markets.
* Yahoo! Finance is the source for any reference to the performance of an index between two specific periods.
* The risk of loss in trading commodities and futures can be substantial. You should therefore carefully consider whether such trading is suitable for you in light of your financial condition. The high degree of leverage is often obtainable in commodity trading and can work against you as well as for you. The use of leverage can lead to large losses as well as gains.
* Opinions expressed are subject to change without notice and are not intended as investment advice or to predict future performance.
* Economic forecasts set forth may not develop as predicted and there can be no guarantee that strategies promoted will be successful.
* Past performance does not guarantee future results. Investing involves risk, including loss of principal.
* The foregoing information has been obtained from sources considered to be reliable, but we do not guarantee it is accurate or complete.
* There is no guarantee a diversified portfolio will enhance overall returns or outperform a non-diversified portfolio. Diversification does not protect against market risk.
* Asset allocation does not ensure a profit or protect against a loss.
* Consult your financial professional before making any investment decision.
Sources: 
https://www.bls.gov/news.release/cpi.nr0.htm 
https://www.barrons.com/livecoverage/inflation-september-cpi-report?mod=hp_LEDE_C_2  or go to  https://resources.carsongroup.com/hubfs/WMC-Source/2025/10-27-25-Barrons-September-Inflation-Was-Softer-2.pdf 
https://www.barrons.com/livecoverage/stock-market-news-today-102425?mod=hp_LEDE_C_3 or go to https://resources.carsongroup.com/hubfs/WMC-Source/2025/10-27-25-Barrons-DOW-Cracks-47000-3.pdf 
https://www.bloomberg.com/news/articles/2025-10-24/us-treasuries-jump-as-inflation-report-reinforces-rate-cut-bets or go to https://resources.carsongroup.com/hubfs/WMC-Source/2025/10-27-25-Bloomberg-Bonds-Erase-Post-CPI-Gains-4.pdf 
https://www.pmi.spglobal.com/Public/Home/PressRelease/eb6ffb6222214cbfbb42d44541c5ebbe
https://www.federalreserve.gov/faqs/why-do-interest-rates-matter.htm 
https://blog.ssa.gov/social-security-announces-benefit-increase-for-2026/ 
https://www.barrons.com/market-data?mod=BOL_TOPNAV  or go to  https://resources.carsongroup.com/hubfs/WMC-Source/2025/10-27-25-Barrons-DJIA-SP-NASDAQ-8.pdf 
https://home.treasury.gov/resource-center/data-chart-center/interest-rates/TextView?type=daily_treasury_yield_curve&field_tdr_date_value=2025 
https://www.bloomberg.com/news/articles/2025-10-22/wildfires-and-severe-weather-drive-record-us-disaster-losses  or go to https://resources.carsongroup.com/hubfs/WMC-Source/2025/10-27-25-Bloomberg-The-US-Saw-Record-10.pdf 
https://www.climatecentral.org/climate-services/billion-dollar-disasters 
https://www.climatecentral.org/climate-services/billion-dollar-disasters/state-summary/united-states?begYear=2024&endYear=2025&s=beginDate%3Aasc&f=beginDate%3Abetween%3A20240101..20251231&ps=50 
https://www.usnews.com/insurance/homeowners-insurance/climate-change-and-rates
https://www.goodreads.com/quotes/tag/weather?page=2