
The Jobs Report Was Strong. The Selloff Happened Anyway. Here's What's Actually Coming.
Strong jobs data, a NASDAQ off 4.65%, and yields pushing higher — and now every eye turns to Wednesday's CPI. Here's what the market is really pricing, and what it means for retirement portfolios managing income in a higher-for-longer world.
The Week in Markets
U.S. equity markets fell broadly last week, in a move that confused anyone who only looked at the headline jobs number. The May employment report came in strong — 172,000 new payrolls, unemployment steady at 4.3%, services activity still expanding — and stocks sold off anyway.
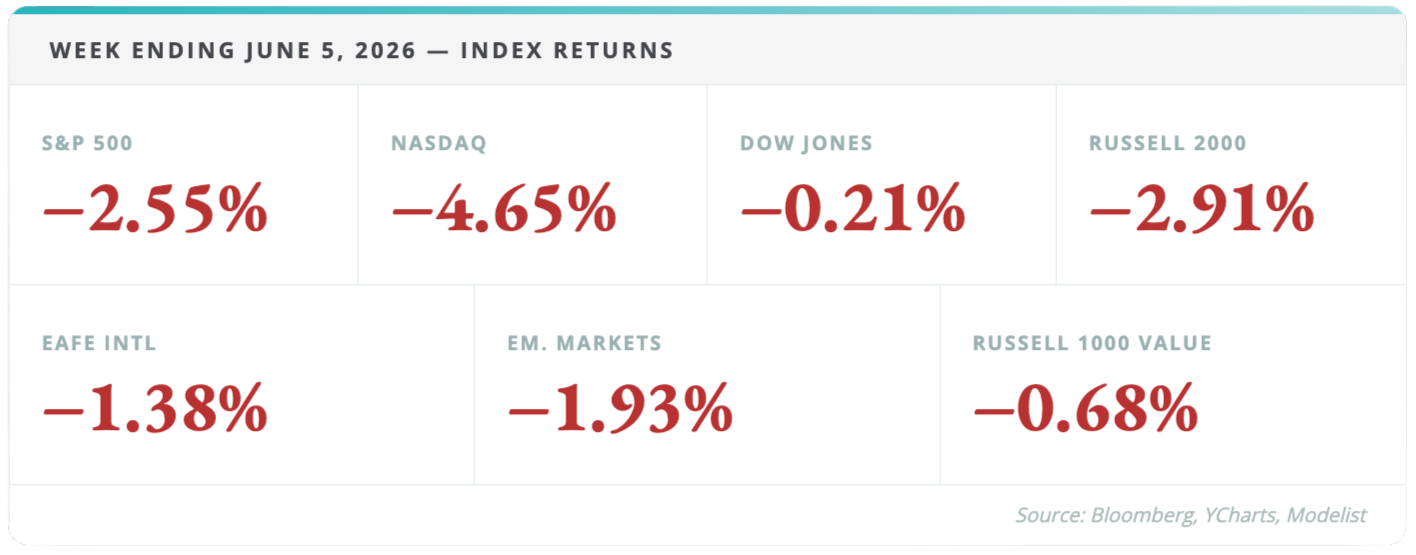
The NASDAQ led the decline at −4.65%. The S&P 500 fell 2.55%. The Dow held up relatively well, slipping just 0.21%. Under the surface, the rotation was stark: the Russell 1000 Value dropped only 0.68% while the Russell 1000 Growth fell 4.02% — a spread that tells you exactly which kind of assets bore the brunt of the repricing.
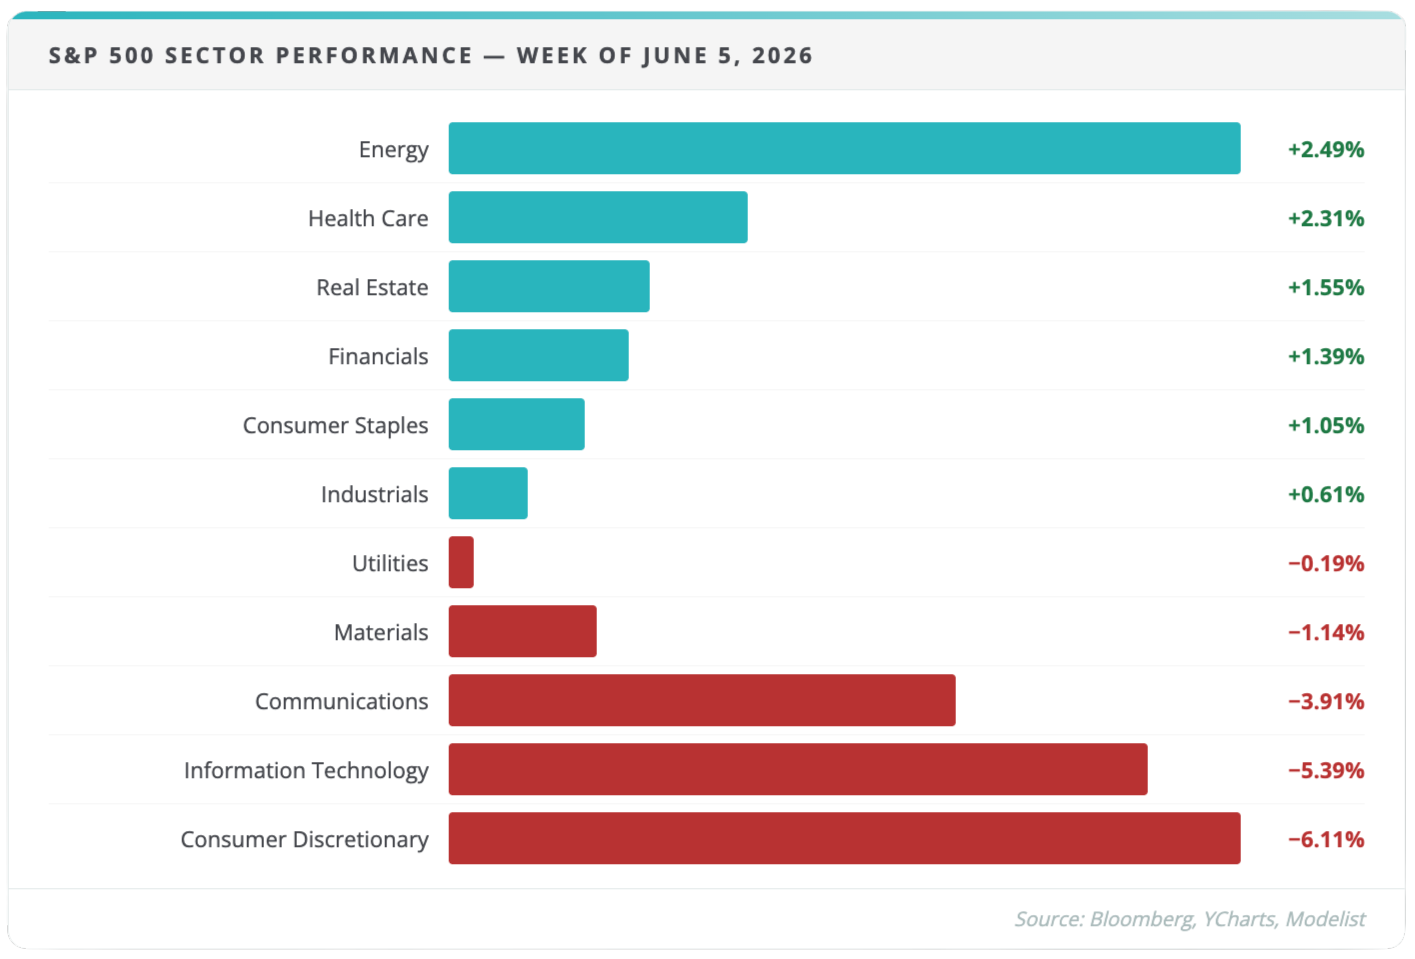
At the sector level, the two hardest-hit areas — Consumer Discretionary (−6.11%) and Information Technology (−5.39%) — are the two most sensitive to rate expectations. Energy (+2.49%) and Health Care (+2.31%) held up best. Overseas, the MSCI EAFE fell 1.38%, and Emerging Markets dropped 1.93% as South Korea fell over 14%.
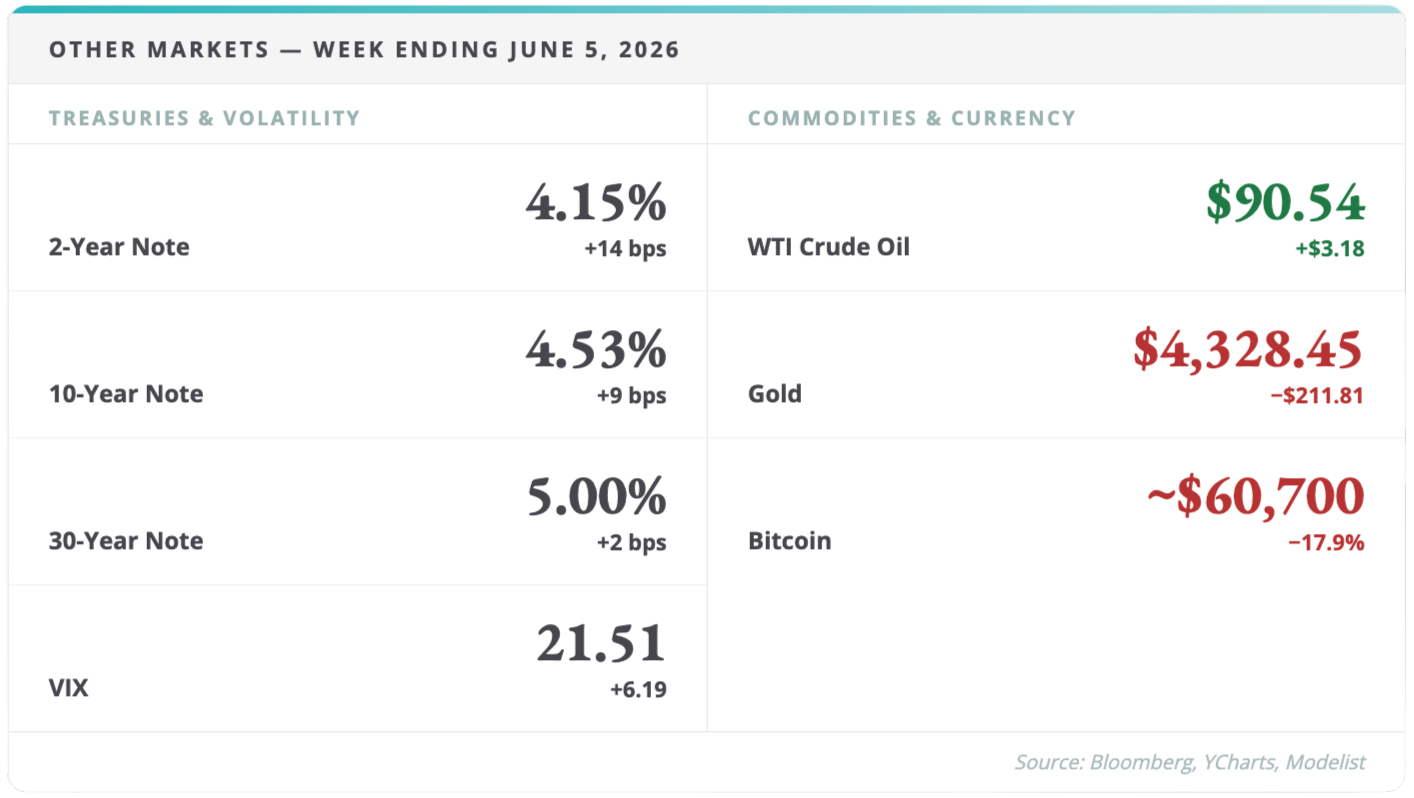
In fixed income, yields pushed higher across the curve. The 2-year Treasury rose 14 basis points to 4.15%. The 10-year moved up 9 basis points to 4.53%. The VIX jumped 6.19 points to close at 21.51. Gold fell to $4,328.45. Crude oil settled at $90.54 after briefly touching $96. Bitcoin fell nearly 18% to close near 60,700.

Things We're Watching
1. Good News Became a Rate-Risk Story — and the Bond Market Moved First
The selloff last week wasn't about the economy weakening. It was about what a strong economy means for the Fed's timeline.
172,000 new jobs and a 4.3% unemployment rate give the Fed no urgency to cut. The bond market understood that immediately — the 2-year yield's 14-basis-point move happened within hours of the Friday release. Equity markets followed.
The if/then that matters: If Wednesday's CPI confirms that inflation is still sticky — particularly if energy prices are feeding through — the case for a 2026 rate cut gets pushed further out. That's not a catastrophe, but it is a direct input into bond valuations, dividend stock pricing, and the yield environment that governs how retirees structure income. A prolonged pause is a known condition; the danger is portfolios still positioned for rate relief that hasn't arrived.
2. AI Hit Its First Real Gut Check
AI optimism has been the single largest driver of equity returns for two years. Last week was the first week that story faced serious pushback — not because the technology is failing, but because investors started asking how much of the future is already priced in.
Consumer Discretionary fell 6.11%. Information Technology dropped 5.39%. The bottom performers read like a roll call of the prior cycle's winners: Coinbase −19.4%, Ciena −15.9%, Broadcom −13.7%, QUALCOMM −13.6%, Intel −13.5%, Palantir −13.4%.
At the same time, the top performers told a different story. Humana gained 14.6%. Hewlett Packard Enterprise rose 14.3%. Medtronic added 10.6%. Stable cash flows, pricing power, lower rate sensitivity — these were the characteristics that held up.
The if/then that matters: This doesn't mean AI is over. It means leadership may be broadening — toward infrastructure, power, profitable enablers, and the healthcare and industrial names that benefit from AI adoption without carrying the valuation premium. If that rotation continues, portfolios concentrated in last cycle's winners face a different risk profile than they did six months ago.
3. Oil Is the Inflation Wild Card — and It Feeds Directly Into Wednesday's Number
Crude oil briefly moved above $96 last week before settling near $90.54. That's not a minor footnote. Energy prices are a direct input into inflation readings — through transportation costs, utility bills, and manufacturing inputs — and the CPI and PPI reports arrive this week with those prices still elevated.
A geopolitical de-escalation could reverse oil's move quickly, the same way a U.S.-Iran ceasefire headline sent crude sharply lower the prior week. But a sustained energy shock would challenge margins, consumer spending, and the Fed's ability to look past inflation data.
The if/then that matters: If CPI comes in above expectations Wednesday — with energy as a contributing factor — yields push higher and the pressure on rate-sensitive income strategies continues. If energy's effect is muted and core inflation softens, the path toward eventual rate relief reopens. Either way, oil's behavior this week is a direct variable in the number that moves markets.
Want the Full Picture?
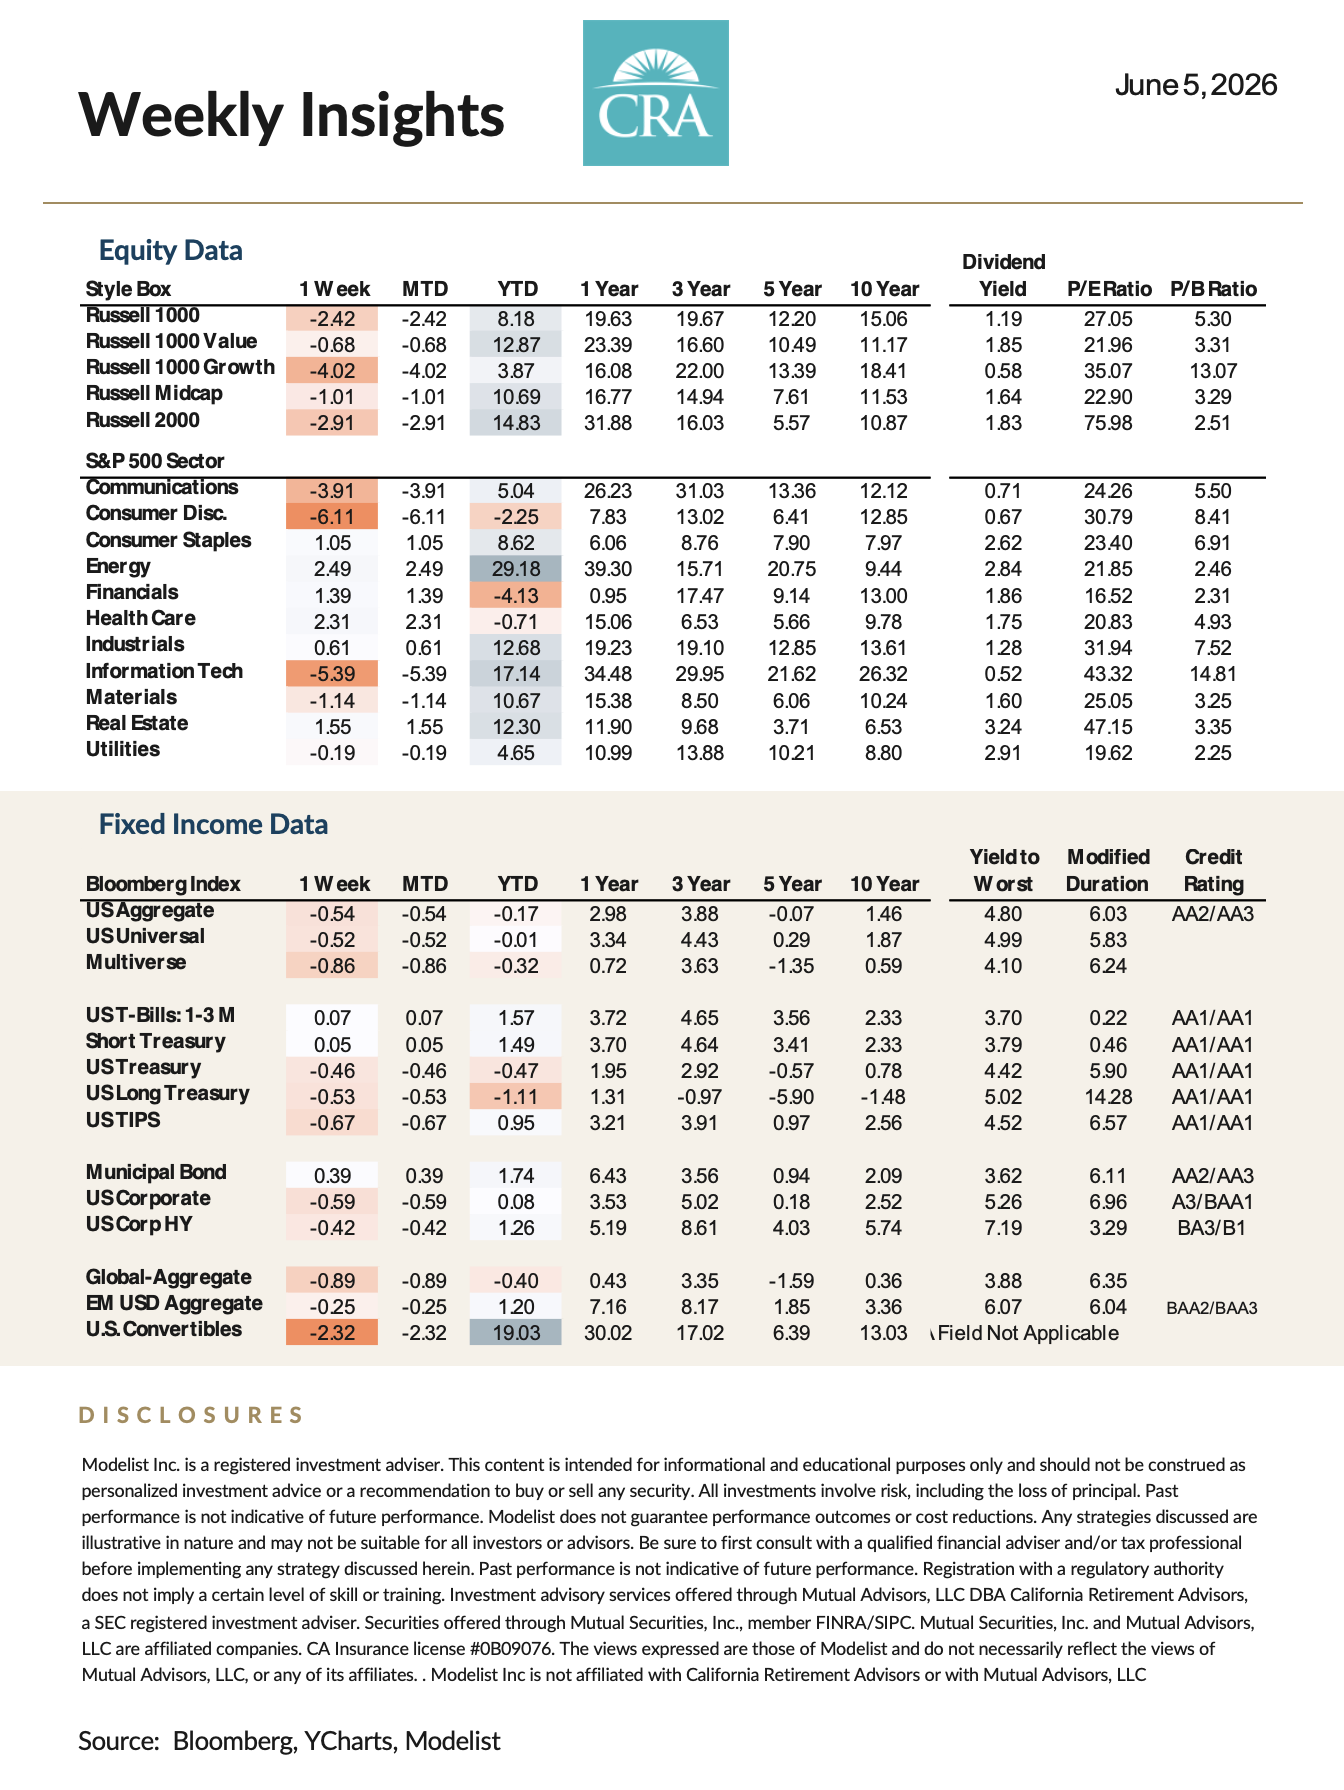
The full Market Insights report includes multi-period equity and fixed income data, sector detail tables, style box performance, and the complete economic calendar for the week ahead.
View Full Weekly Market Report →
What This Means for Your Retirement Plan
Last week's action — a NASDAQ off 4.65%, yields pushing higher, tech and semiconductors leading the decline — was exactly the kind of week a coordinated retirement plan is built for.
For CRA clients: the questions this week raises aren't open questions in your plan. Your income strategy isn't structured around a single Fed decision. Your bond exposure isn't a bet on when yields fall — it's sized to your timeline and your floor. Your Roth conversion math was built around a range of rate scenarios, not one. Wednesday's CPI print will move markets. It won't move your plan.
For those not yet working with a structured approach, this week is a useful lens. Three questions worth sitting with before Wednesday's number lands:
Do you know your bond portfolio's duration — and what another 10-basis-point move in the 10-year does to it? Do you know how concentrated your equity exposure is in the names that led the last two years, now that those names are the first to sell off when rate expectations shift? And does your income strategy have a defined answer for what happens if rates stay at current levels through the end of 2026 — not as a worst case, but as a base case?
If those questions don't have clear answers, that's not a gap in your knowledge. It's a gap in your plan. The 20-Minute Due-Diligence Q&A Call is where that conversation starts.
Schedule a 20-Minute Due-Diligence Q&A Call →