

Weekly Market Insights — Records, AI ROI, and a Sticky Inflation Problem
The Week in Markets
The S&P 500 and Nasdaq closed at fresh all-time highs — even as inflation told a different story.
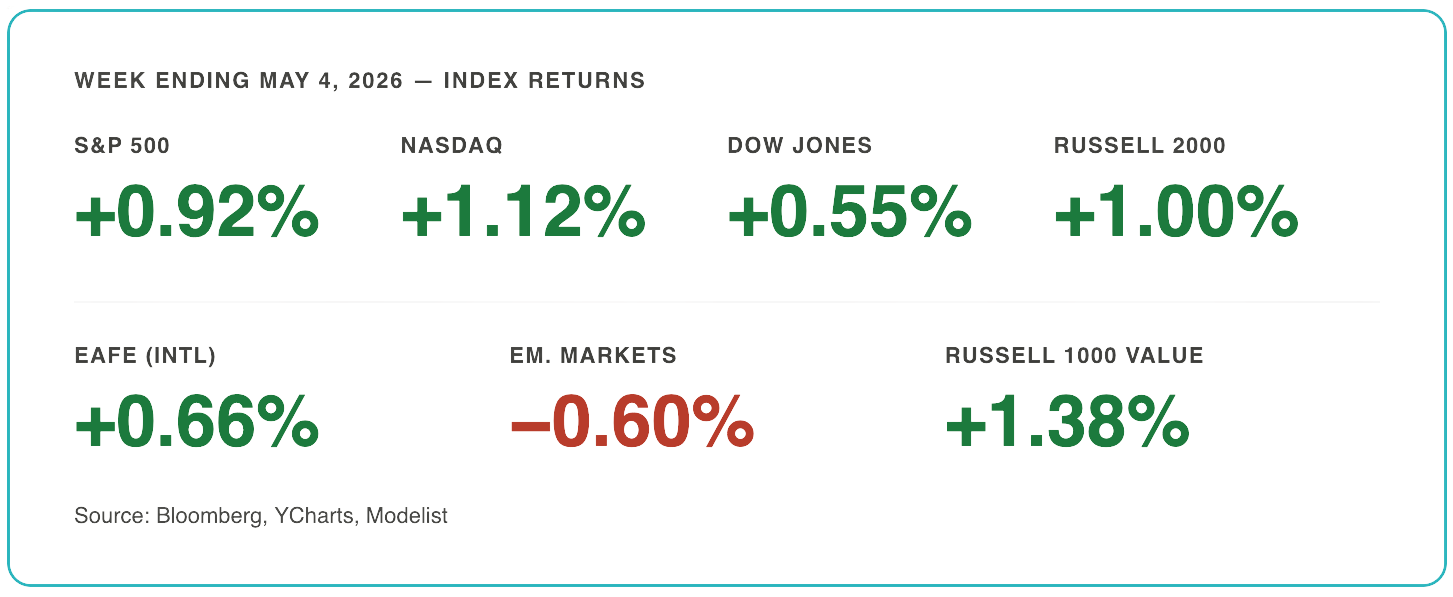
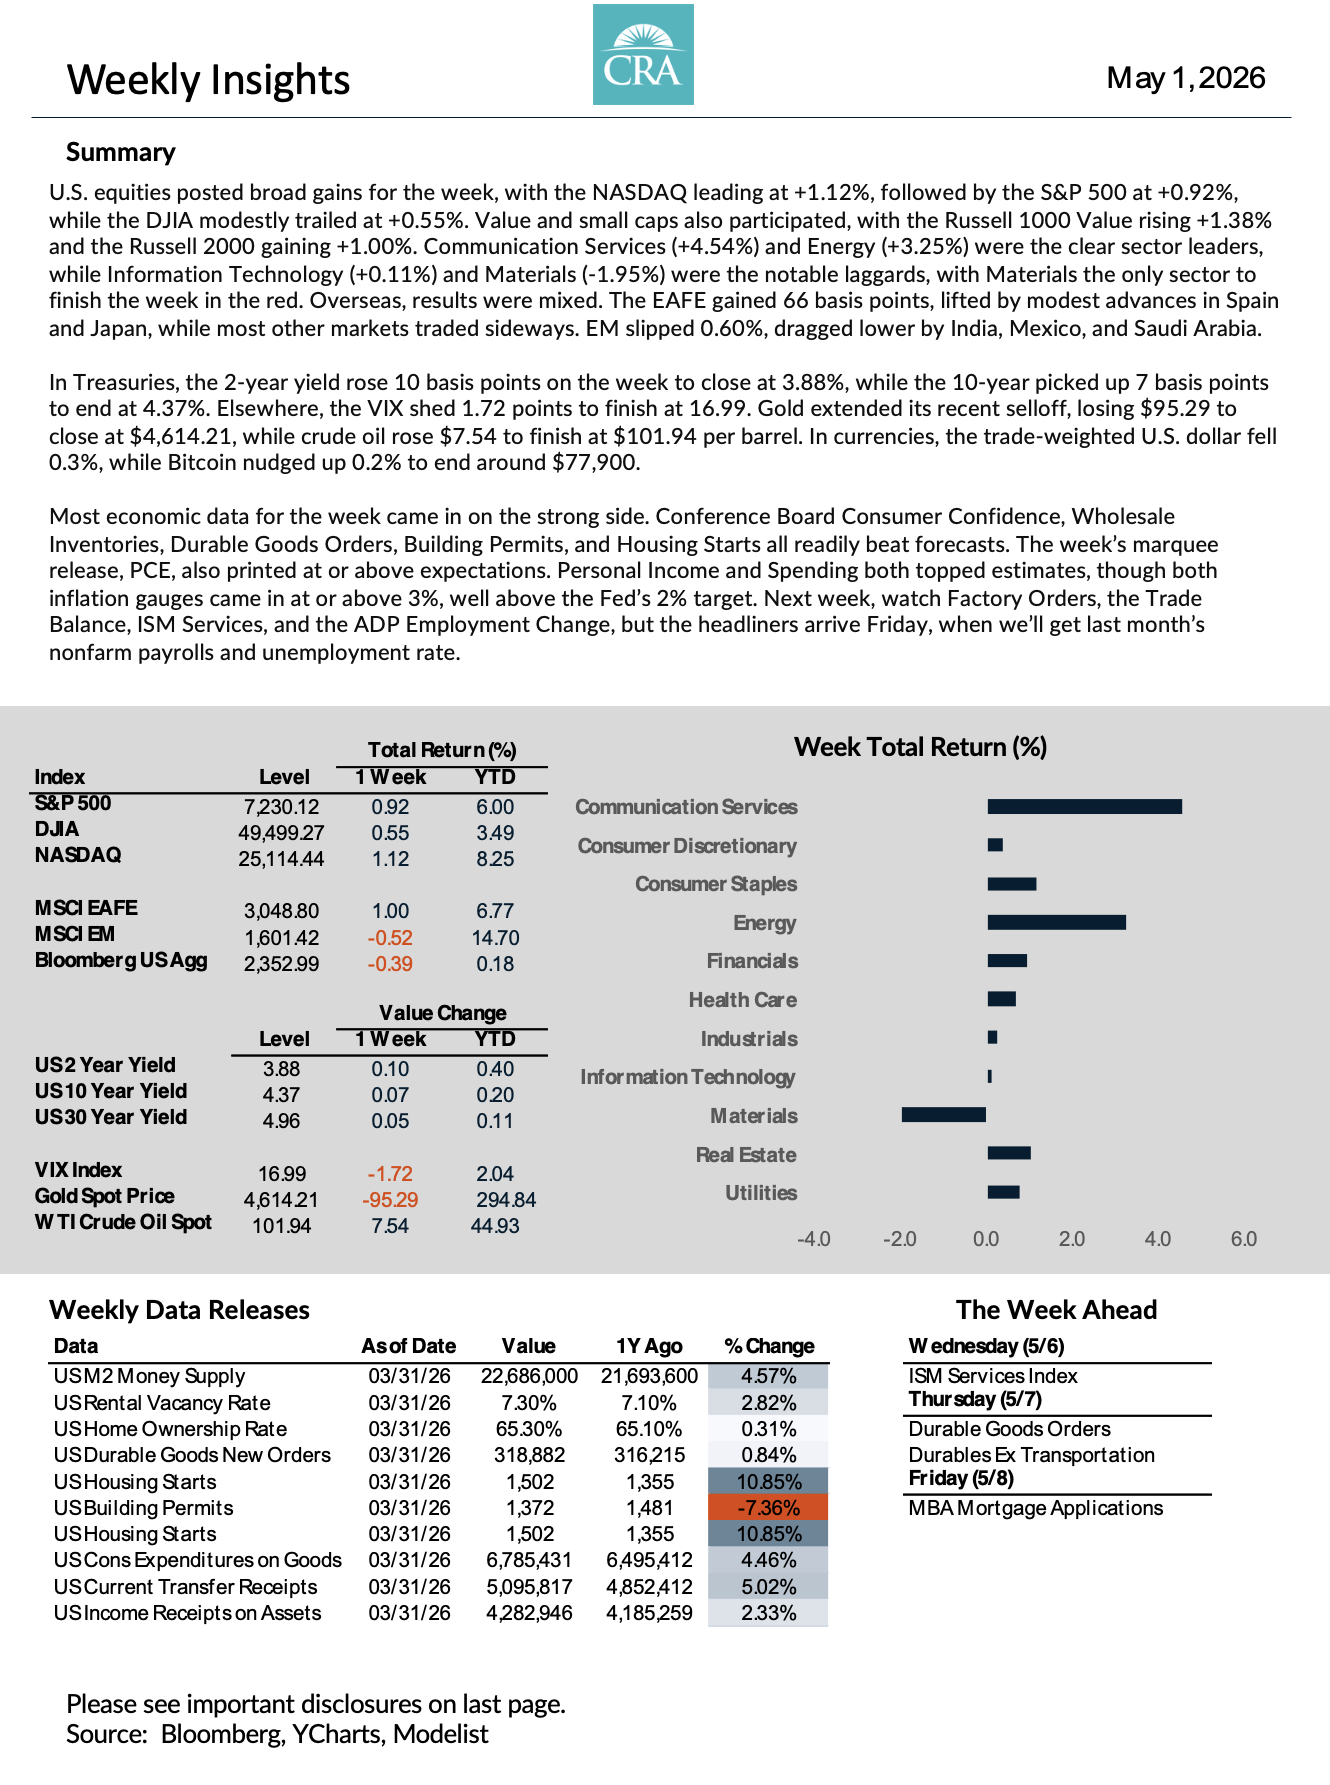
U.S. equities posted broad gains across the board. The NASDAQ led major indexes with a 1.12% advance, the S&P 500 gained 0.92%, and the Dow rose 0.55%. Value and smaller companies kept pace — the Russell 1000 Value gained 1.38% and the Russell 2000 rose 1.00%.
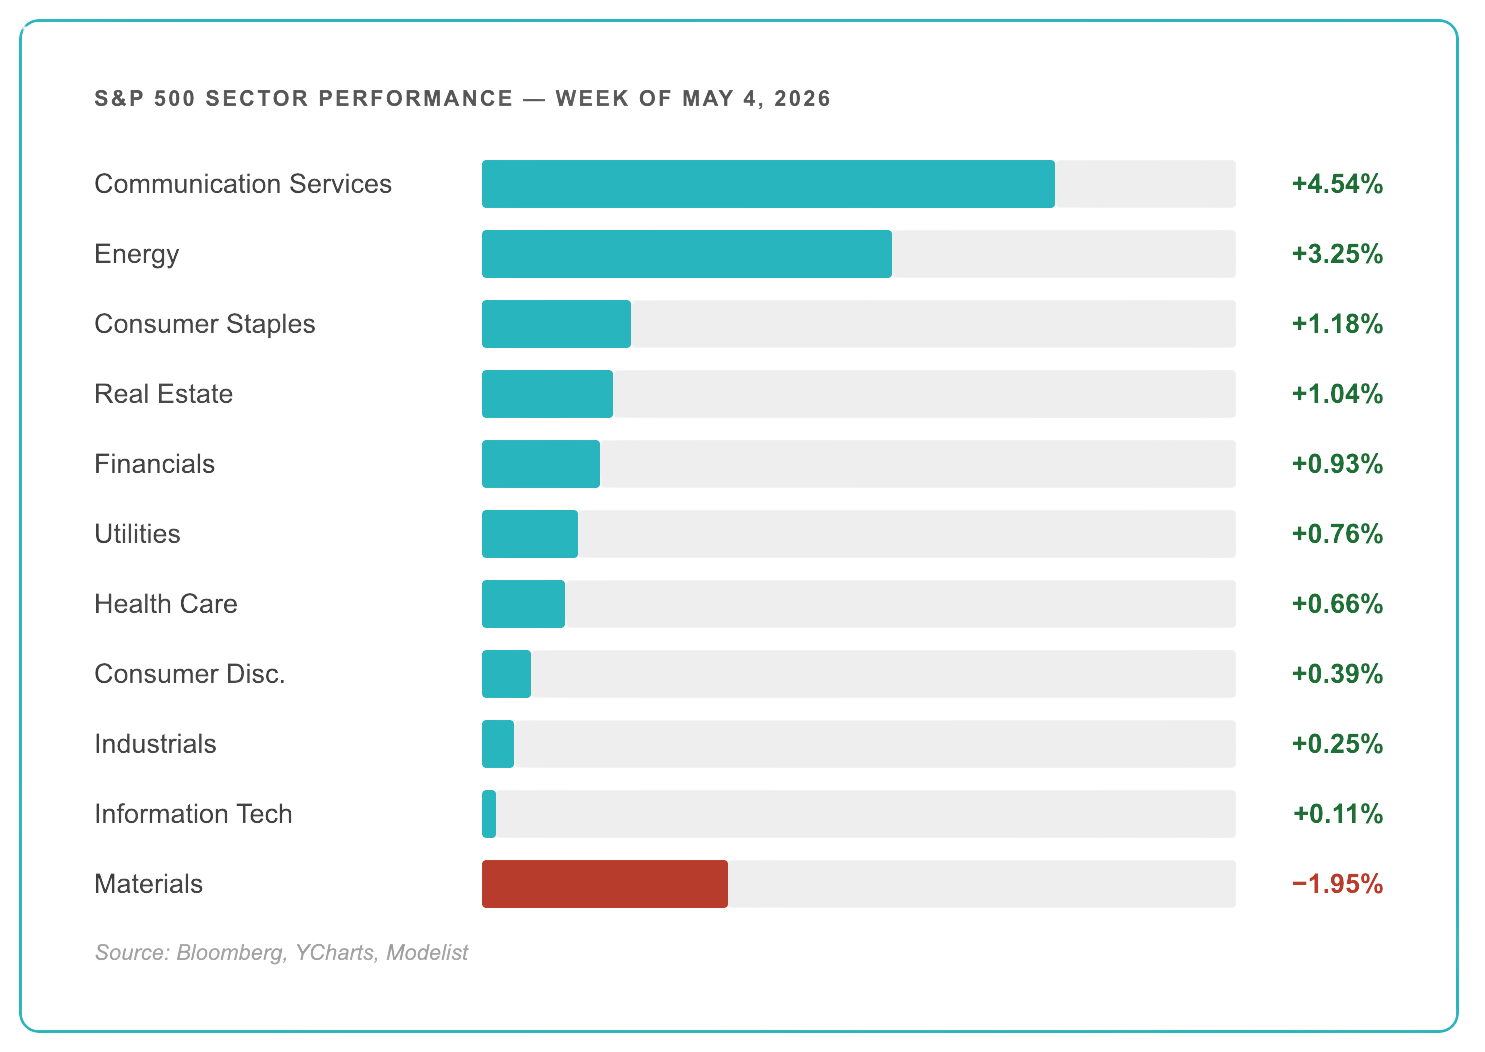
At the sector level, Communication Services (+4.54%) and Energy (+3.25%) were the clear leaders for the week. Information Technology barely moved at +0.11%, and Materials was the only sector to finish in the red, down 1.95%.
International results were mixed. The EAFE gained 0.66%, lifted by modest advances in Spain and Japan, while most other markets traded sideways. Emerging markets slipped 0.60%, dragged lower by India, Mexico, and Saudi Arabia.
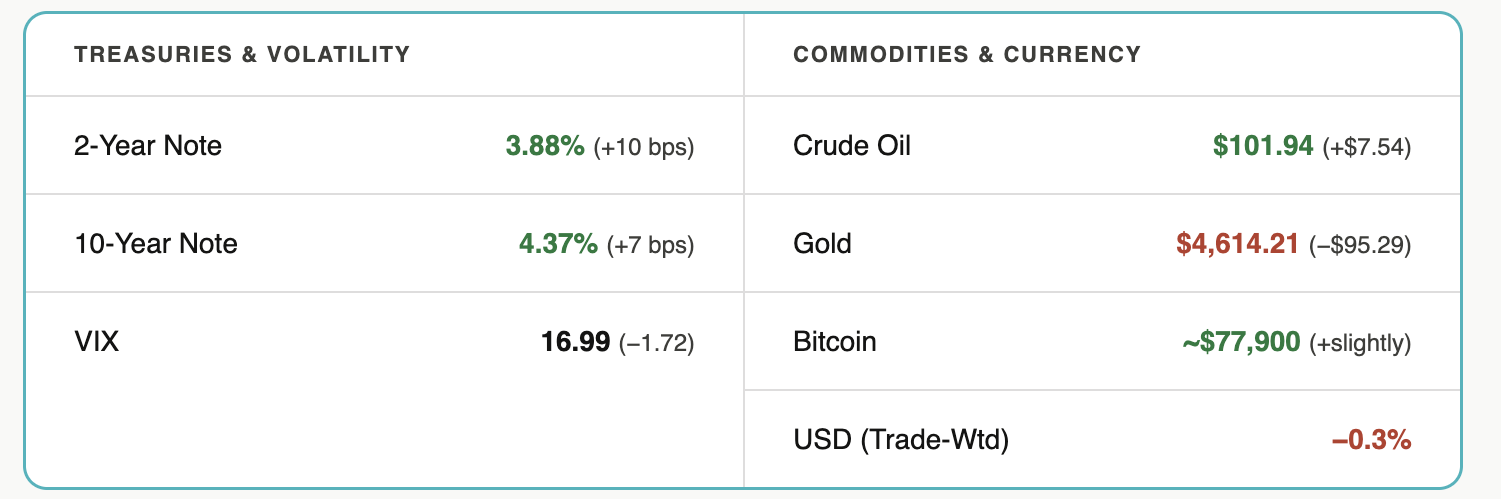
In other markets: the VIX shed 1.72 points to close at 16.99 — a calmer backdrop than recent weeks. Gold extended its selloff, losing $95.29 on the week. Crude oil rose $7.54 to finish at $101.94 per barrel. The trade-weighted U.S. dollar fell 0.3%. Bitcoin edged up 0.2% to close around $77,900. In Treasuries, the 2-year yield rose 10 basis points to 3.88%, while the 10-year picked up 7 basis points to end at 4.37%.
Economic data for the week came in broadly strong. Conference Board Consumer Confidence, Wholesale Inventories, Durable Goods Orders, Building Permits, Housing Starts, and PCE all beat forecasts. Personal Income and Spending both topped estimates — though both inflation gauges printed at or above 3%, well above the Fed’s 2% target.
Things We’re Watching This Week
1. Records Despite the Noise: Apple Caps a Banner April
The S&P 500 and Nasdaq closed at fresh all-time highs to end the week, with the Nasdaq topping 25,000 on the back of an Apple earnings beat and an improved June-quarter outlook. April finished as the strongest month for the broad index in five years — even with crude elevated and geopolitical pressure on global shipping.
Investors are anchoring on resilient corporate fundamentals and looking past macro headlines for now. That calculus holds as long as earnings and guidance keep confirming it. When that changes, markets will reprice quickly.
2. AI Capex Survives the Stress Test — But the Bar Is Rising
Q1 blended S&P 500 earnings growth tracked near 27%, the best print since late 2021. Hyperscaler capital expenditure on AI infrastructure is on pace to approach $700 billion this year. Markets rewarded names showing near-term monetization — Alphabet was a standout — and punished spend without a clear return path. An OpenAI revenue miss midweek briefly snapped an 18-session semiconductor win streak.
AI ROI disclosure is becoming the dividing line between leaders and laggards. It’s no longer enough to announce large capital budgets — the market wants to see the return. Watch next-quarter commentary closely.
3. Growth Reaccelerates, But Inflation and the Fed Stay Sticky
Advance Q1 GDP printed at 2.0%, a step up from 0.5% in Q4, with core capital goods orders rising 3.3% as business investment firmed. Less comfortable: the PCE price index ran at 4.5% and core PCE at 4.3% — well above the Fed’s 2% target, with internal dissenters pushing back on any signal of cuts.
With April payrolls, the Trade Balance, ISM Services, and ADP Employment Change all on deck this week, rates and dollar strength remain the swing factors going into May. The Fed is on hold, and the data needs to shift meaningfully before that changes.
Want the Full Picture?
The complete Market Commentary report includes detailed index data, fixed income tables, equity performance charts, and the full economic calendar for the week ahead.
What This Means for Your Retirement Plan
Markets can post all-time highs and sticky 4%+ inflation readings in the same week — and both can be true simultaneously. For clients of CRA, this kind of environment is exactly what a coordinated plan is built for. Your income strategy is designed to be independent of what the Nasdaq does in any given week. Your tax exposure and withdrawal sequencing are not tied to sentiment readings or short-term rate moves. The structure is there so that weeks like this one — where the data points in multiple directions at once — require no reaction from you.
For those not yet working with a coordinated plan, this week illustrates the core challenge: when inflation is elevated, the Fed is on hold, earnings are strong but concentrated, and a packed data week looms, it is genuinely difficult to know what to hold, what to adjust, and what to leave alone. A 20-Minute Due-Diligence Q&A Call is not a commitment — it is a conversation to understand whether a more coordinated approach would serve your situation.