facebook twitter instagram linkedin google youtube vimeo tumblr yelp rss email podcast phone blog search brokercheck brokercheck Play Pause
What Could Higher Treasury Rates Mean For the U.S.? Thumbnail

What Could Higher Treasury Rates Mean For the U.S.?

The Markets

Geopolitics roiled financial markets.

Just a couple of weeks ago, many analysts and asset managers expressed broad optimism about the potential performance of United States stock markets in 2026 – and the stock market started the year strong. “The S&P 500 closed at new records three times in the first seven trading days of 2026, and isn’t far from its all-time high,” reported Teresa Rivas of Barron’s in mid-January.

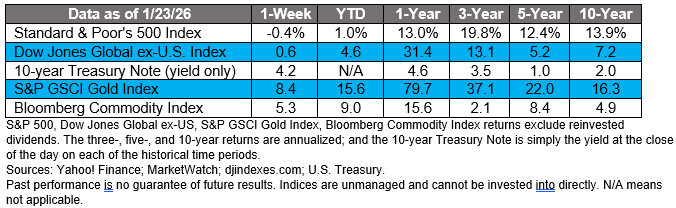
U.S. stocks moved lower last week

Early last week, markets focused sharply on the elephant in the room – geopolitics. Lynn Thomasson and Sabrina Nelson Garcinuno of Bloomberg reported:

“For weeks on Wall Street, markets were unusually subdued as President Donald Trump threatened the post-war order by asserting US dominance of the Western hemisphere. But with his drive to take over Greenland throwing the European and American alliance in disarray…the calm abruptly snapped. As stock markets opened on Tuesday, the ‘Sell America’ trade came back in full force…The S&P 500 dropped over 2 [percent], erasing all of this year’s gains.”

U.S. Treasury yields moved higher

The U.S. Treasury market swooned, too. The yield on 30-year U.S. Treasury bonds rose from 4.79 percent at the end of the previous week to 4.91 percent on Tuesday. 

The U.S. wasn’t the only country to see yields move higher. Global bond yields rose after the Japanese Prime Minister proposed to cut taxes on food, which bond markets feared could lead to higher inflation. Phil Serafino of Bloomberg explained: 

“…higher yields act as a powerful magnet, pulling Japanese savers’ money out of markets around the globe and drawing it back home. That means less demand for sovereign bonds such as [U.S.] Treasuries,” wrote Serafino. “Another factor: governments and companies are flooding the market with new bonds as they ramp up spending on defense, data centers, and just about everything else,” explained Serafino. 

The law of supply and demand holds that a rising supply of bonds in combination with falling demand is likely to lead to lower bond prices and higher interest rates, reported Jason Fernando of Investopedia.  

By the end of the week, U.S. stock and bond markets had calmed. “The S&P 500 danced around the breakeven line Friday afternoon while the Dow Jones Industrial Average was down…and the Nasdaq Composite was up,” reported Karishma Vanjani of Barron’s. The yield on the 30-year U.S. Treasury bond finished the week at 4.82 percent.


What Could Higher Treasury Rates Mean For The U.S.?

The U.S. government spends a lot of money. Some of that spending is covered by with taxes, tariffs, and other sources of revenue. When that’s not enough, the government borrows the money it needs to operate.

The U.S. borrows money by issuing U.S. Treasury bills, notes, and bonds. When a person, company, or country buys a U.S. Treasury, they are lending the government money. In return, the United States agrees to pay interest for a specific period of time and then return the amount borrowed.

The interest the United States pays on Treasuries is a lot like the interest people pay on outstanding credit card balances. The higher the debt, the more interest is owed.

U.S. interest costs are growing

Officially, the U.S. government’s spending year begins in October, which can be confusing. The period from October through December 2025 is known as the first quarter of Fiscal Year 2026 (FY26).

Over that period, Fiscal Data reported the federal government:

  • Spent $1.83 trillion, 
  • Collected $1.22 trillion, and 
  • Ran short by about $602 billion.

In FY26, the government spent more on interest on the national debt (+13 percent), and Social Security and Medicare (+9 percent). It spent less on the Environmental Protection Agency (-81 percent), Department of Homeland Security/FEMA disaster relief (-38 percent), Department of Education (-26 percent), and Department of Agriculture (-18 percent).

For context, in FY 2025 (the period from October 1, 2024, to September 30, 2025), the U.S. government:

  • Spent $7.01 trillion,
  • Collected $5.23 trillion, and
  • Ran short by $1.78 trillion.

Higher interest costs mean less money for other priorities

As interest costs rise, they tend to “crowd out opportunities for investment in other important priorities. In fact, the [United States] government is already spending more on interest costs than on education, research and development, and infrastructure combined. If unaddressed, the growing borrowing costs will pose significant challenges for the nation’s fiscal future,” reported the Peter G. Peterson Foundation.


Weekly Inspiration

“Trust yourself. Create the kind of self that you will be happy to live with all your life. Make the most of yourself by fanning the tiny, inner sparks of possibility into flames of achievement.”

― Golda Meir, Former Israeli Prime Minister 

Best Regards,
California Retirement Advisors


Investment advisory services offered through Mutual Advisors, LLC DBA California Retirement Advisors, a SEC registered investment advisor. Securities offered through Mutual Securities, Inc., member FINRA/SIPC. Mutual Securities, Inc. and Mutual Advisors, LLC are affiliated companies. CA Insurance license #0B09076. This content is developed from sources believed to be providing accurate information and provided by California Retirement Advisors. It may not be used for the purpose of avoiding any federal tax penalties. Please consult legal or tax professionals for specific information regarding your individual situation. The opinions expressed and material provided are for general information and should not be considered a solicitation for the purchase or sale of any security. California Retirement Advisors, nor any of its members, are tax accountants or legal attorneys and do not provide tax or legal advice. For tax or legal advice, you should consult your tax or legal professional.
The information being provided is strictly as a courtesy. When you click on any of the links provided here, you are leaving this website and viewing information provided by a third party. We make no representation as to the completeness or accuracy of information provided by any third-party website. Nor is the company liable for any direct or indirect technical or system issues or any consequences arising out of your access to, or your use of third-party technologies, websites, information and programs made available through this website. By accessing these calculators, you assume total responsibility and risk for your use of the third-party website.
* These views are those of Carson Coaching, not the presenting Representative, the Representative’s Broker/Dealer, or Registered Investment Advisor, and should not be construed as investment advice.
* Government bonds and Treasury Bills are guaranteed by the U.S. government as to the timely payment of principal and interest and, if held to maturity, offer a fixed rate of return and fixed principal value.  However, the value of fund shares is not guaranteed and will fluctuate.
* Corporate bonds are considered higher risk than government bonds but normally offer a higher yield and are subject to market, interest rate and credit risk as well as additional risks based on the quality of issuer coupon rate, price, yield, maturity, and redemption features.
* The Standard & Poor's 500 (S&P 500) is an unmanaged group of securities considered to be representative of the stock market in general. You cannot invest directly in this index.
* All indexes referenced are unmanaged. The volatility of indexes could be materially different from that of a client’s portfolio. Unmanaged index returns do not reflect fees, expenses, or sales charges. Index performance is not indicative of the performance of any investment. You cannot invest directly in an index.
* The Dow Jones Global ex-U.S. Index covers approximately 95% of the market capitalization of the 45 developed and emerging countries included in the Index.
* The 10-year Treasury Note represents debt owed by the United States Treasury to the public. Since the U.S. Government is seen as a risk-free borrower, investors use the 10-year Treasury Note as a benchmark for the long-term bond market.
* Gold represents the 3:00 p.m. (London time) gold price as reported by the London Bullion Market Association and is expressed in U.S. Dollars per fine troy ounce. The source for gold data is Federal Reserve Bank of St. Louis (FRED), https://fred.stlouisfed.org/series/GOLDPMGBD228NLBM.
* The Bloomberg Commodity Index is designed to be a highly liquid and diversified benchmark for the commodity futures market. The Index is composed of futures contracts on 19 physical commodities and was launched on July 14, 1998.
* The DJ Equity All REIT Total Return Index measures the total return performance of the equity subcategory of the Real Estate Investment Trust (REIT) industry as calculated by Dow Jones.
* The Dow Jones Industrial Average (DJIA), commonly known as “The Dow,” is an index representing 30 stock of companies maintained and reviewed by the editors of The Wall Street Journal.
* The NASDAQ Composite is an unmanaged index of securities traded on the NASDAQ system.
* International investing involves special risks such as currency fluctuation and political instability and may not be suitable for all investors. These risks are often heightened for investments in emerging markets.
* Yahoo! Finance is the source for any reference to the performance of an index between two specific periods.
* The risk of loss in trading commodities and futures can be substantial. You should therefore carefully consider whether such trading is suitable for you in light of your financial condition. The high degree of leverage is often obtainable in commodity trading and can work against you as well as for you. The use of leverage can lead to large losses as well as gains.
* Opinions expressed are subject to change without notice and are not intended as investment advice or to predict future performance.
* Economic forecasts set forth may not develop as predicted and there can be no guarantee that strategies promoted will be successful.
* Past performance does not guarantee future results. Investing involves risk, including loss of principal.
* The foregoing information has been obtained from sources considered to be reliable, but we do not guarantee it is accurate or complete.
* There is no guarantee a diversified portfolio will enhance overall returns or outperform a non-diversified portfolio. Diversification does not protect against market risk.
* Asset allocation does not ensure a profit or protect against a loss.
* Consult your financial professional before making any investment decision.
Sources: 
https://www.bloomberg.com/news/articles/2025-12-29/bulls-only-every-wall-street-analyst-now-predicts-a-stock-rally or go to https://resources.carsongroup.com/hubfs/WMC-Source/2026/01-26-26-Bloomberg-Every-Wall-Street-Analyst%20-%201.pdf
https://www.barrons.com/articles/stock-market-rally-iran-venezuela-fed-b5bfac0b? or go to https://resources.carsongroup.com/hubfs/WMC-Source/2026/01-26-26-Barrons-The-World-is-a-Dumpster-Fire%20-%20%202.pdf
https://www.barrons.com/livecoverage/stock-market-news-today-012026?mod=hp_LEDE_C_1 or go to https://resources.carsongroup.com/hubfs/WMC-Source/2026/01-26-26-Bloomberg-Treasuries-Stocks-Sell-Off%20-%203.pdf
https://home.treasury.gov/resource-center/data-chart-center/interest-rates/TextView?type=daily_treasury_yield_curve&field_tdr_date_value=202601
https://www.bloomberg.com/news/newsletters/2026-01-20/japan-is-driving-global-bond-yields-higher? or go to https://resources.carsongroup.com/hubfs/WMC-Source/2026/01-26-26-Bloomberg-Japan-is-Driving-Global%20-%205.pdf
https://www.investopedia.com/terms/b/bond.asp
https://www.barrons.com/livecoverage/stock-market-news-today-012326?mod=hp_LEDE_C_2 or go to https://resources.carsongroup.com/hubfs/WMC-Source/2026/01-26-26-Barrons-The-S&P-500-Teeters%20-%207.pdf
https://www.pgpf.org/federal-budget-guide/
https://www.investopedia.com/terms/t/treasurybond.asp
https://fiscaldata.treasury.gov/americas-finance-guide/
https://bipartisanpolicy.org/report/deficit-tracker
https://fiscaldata.treasury.gov/americas-finance-guide/government-revenue/
https://www.pgpf.org/article/what-are-interest-costs-on-the-national-debt/
https://www.brainyquote.com/quotes/golda_meir_162893?src=t_trust